04 — Run lifecycle: dispatch, one event stream, retries
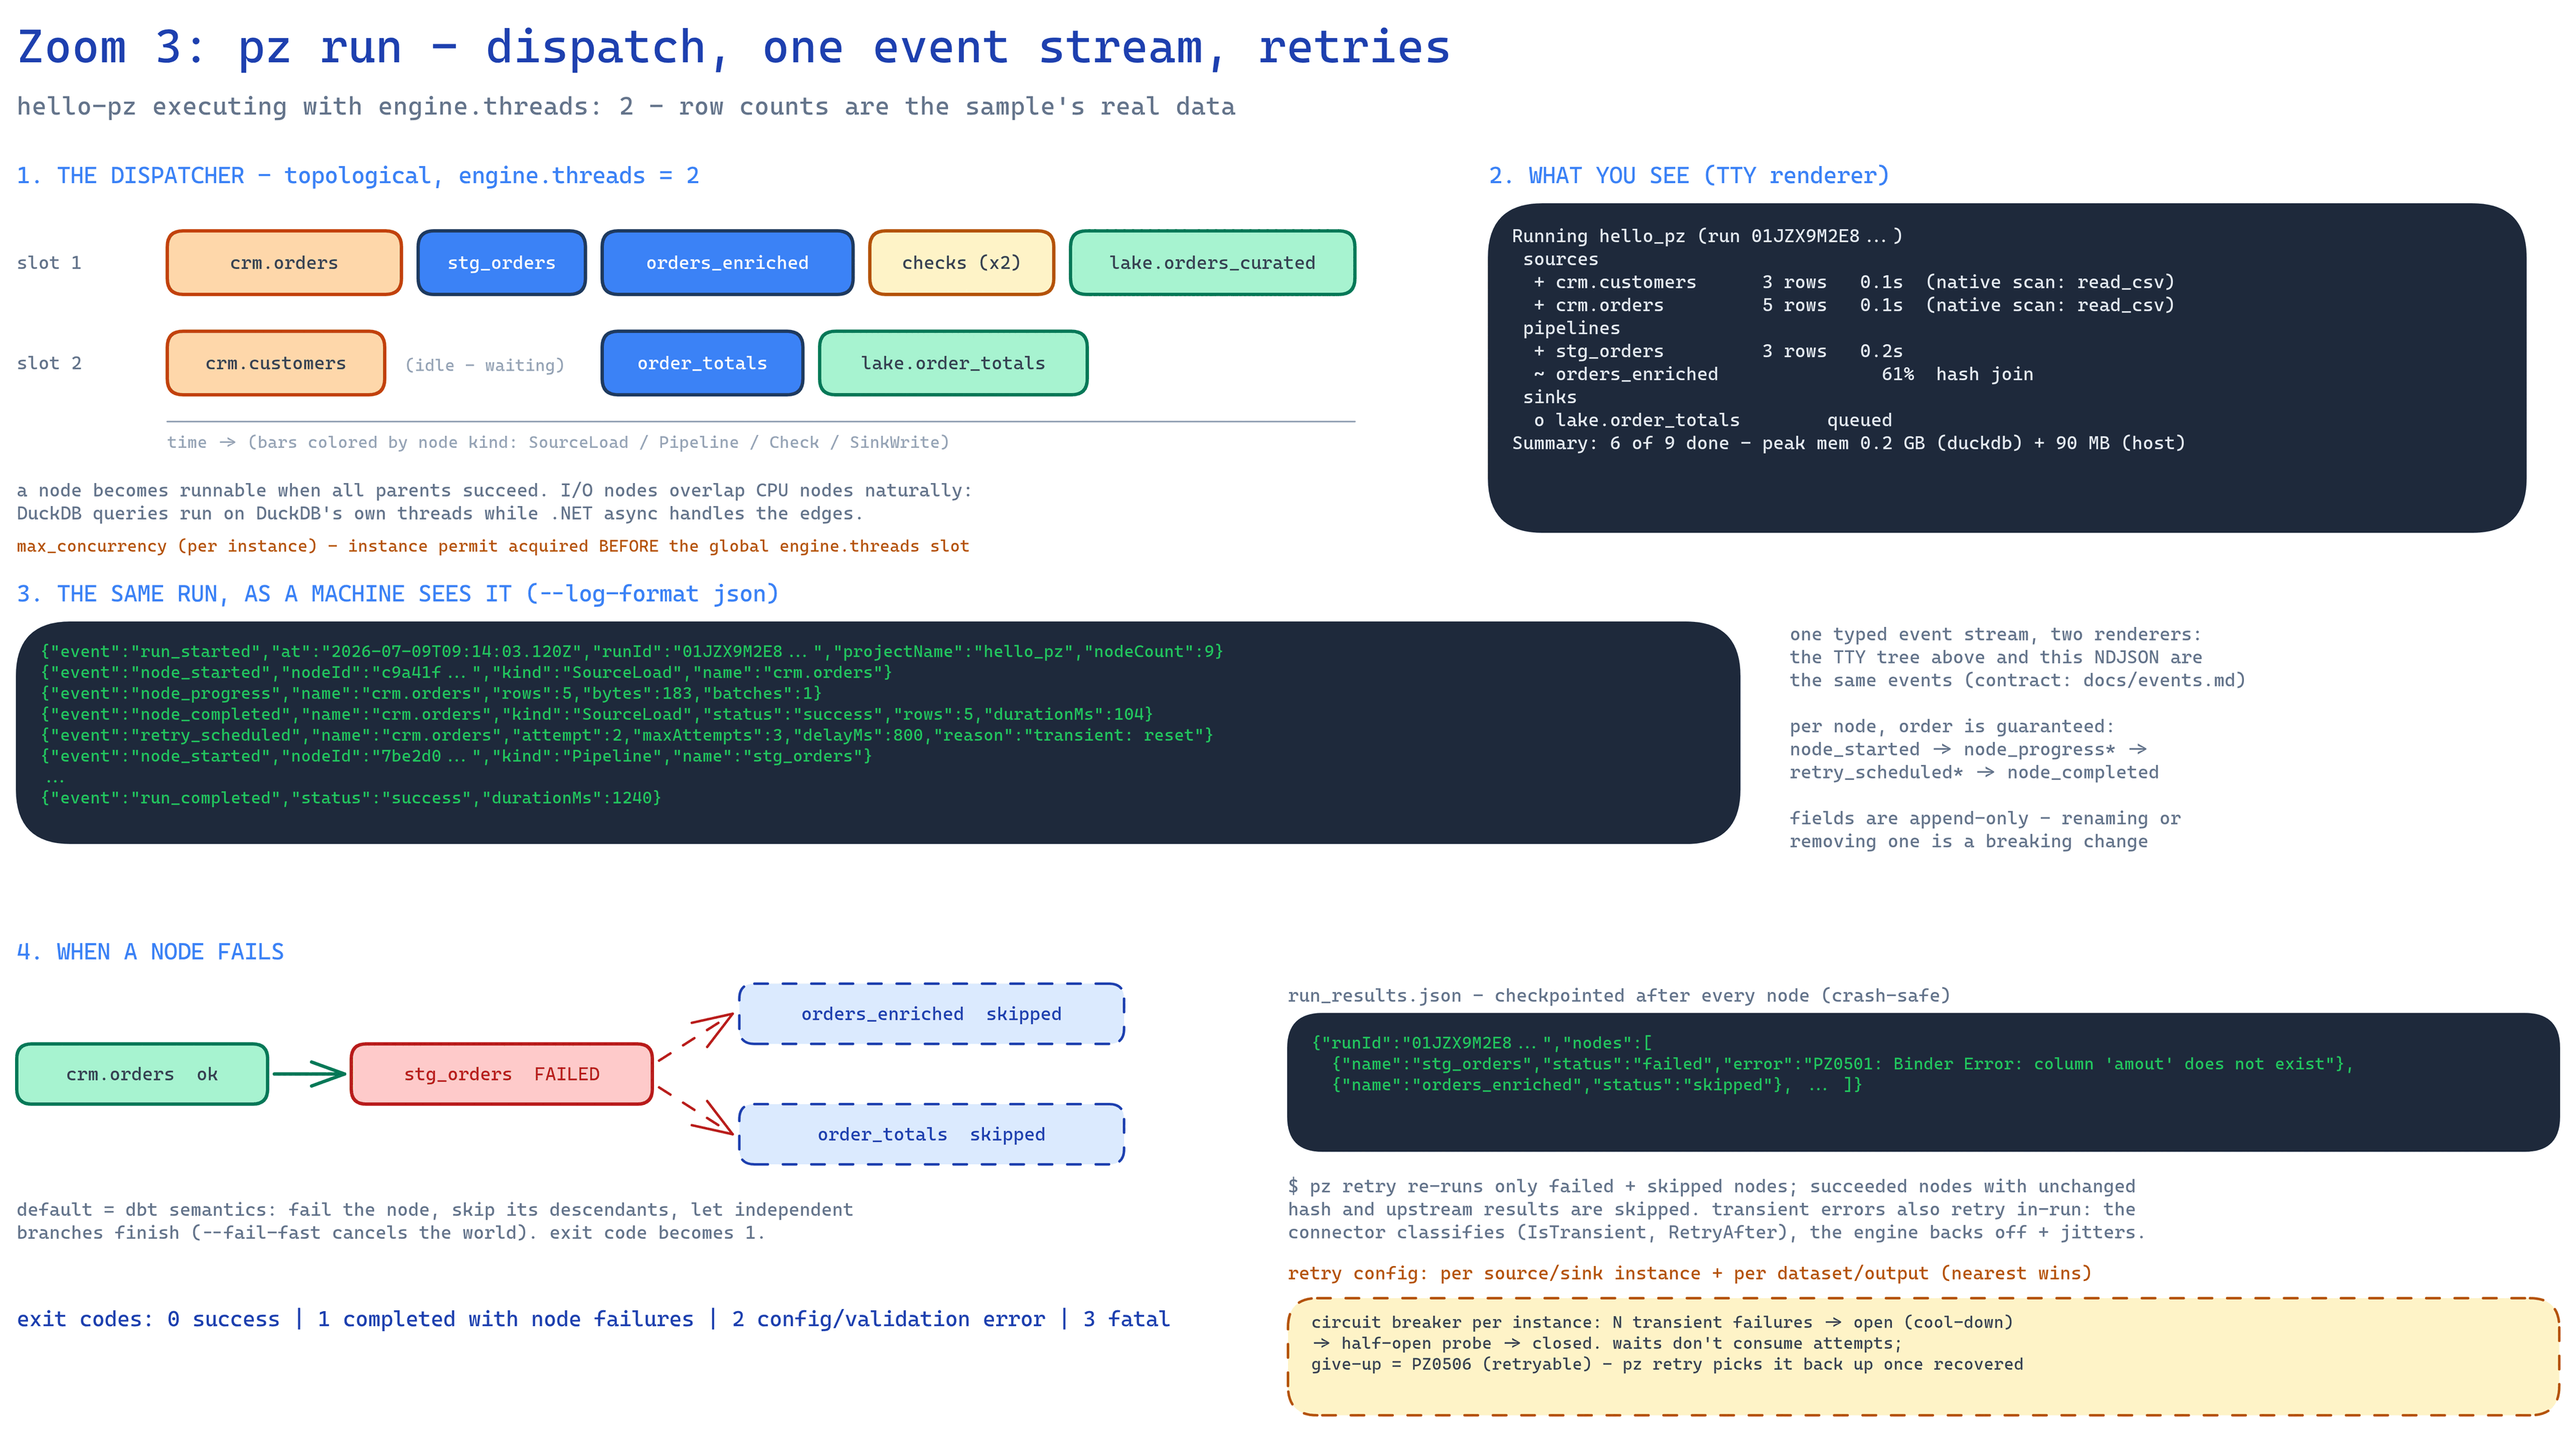
This diagram shows pz run actually executing — the sample project with engine.threads: 2,
real row counts (five orders, three survive the filter). Tiny on purpose: the mechanics are the
point.
A few terms:
- Typed event stream — as the run executes, the engine emits a sequence of structured events
(
node_started,node_completed, …) with fixed, documented fields — not free-form log lines. - Renderer — a consumer that turns that one stream into some view: the live console tree, the machine-readable JSON log, OpenTelemetry metrics. Many views, one source of truth.
engine.threads— the global cap on how many DAG nodes may run at the same time; the same knob dbt callsthreads.
Reading the diagram
Section titled “Reading the diagram”Top left: the dispatcher, shown as two lanes. Dispatch is topological with a global
concurrency limit: a node runs only after everything it depends on has succeeded, and anything
whose parents are done is free to run in parallel. The two lanes are the two worker slots from
engine.threads: 2. Both source loads start immediately in parallel; stg_orders becomes
runnable the moment its parent succeeds; slot 2 goes idle while it waits — dependencies, not
laziness. Bar colors match the DAG slide: orange loads, blue pipelines, yellow checks, green
sink writes.
I/O and CPU overlap naturally: DuckDB queries run on DuckDB’s own thread pool while .NET async handles the edges — while DuckDB is crunching a SQL transform, the .NET side is simultaneously doing network and disk I/O for loads and writes. Nobody hand-tunes that; the overlap comes from the architecture.
The small note under the lanes describes a second, narrower gate: a source or sink instance’s
own max_concurrency: caps how many of that system’s nodes run at once (an instance = one
configured external system, e.g. “this specific SQL Server”). The instance permit is acquired
before the global engine.threads slot — instance-before-global — so a node waiting for a
busy database waits outside the global worker pool and doesn’t occupy a slot that other
systems’ nodes could use.
Top right: what you see. On an interactive terminal, a live tree: per-node status, rows, throughput, and which tier each load used (“native scan: read_csv”). When output is piped to a file or another program — or in CI — the renderer detects it and drops the live tree for plain, log-friendly lines automatically.
Middle: what a machine sees. The same run with --log-format json produces NDJSON —
newline-delimited JSON, one object per line, the standard format for machine-parsed logs. The
important sentence: these are not two logging systems. There is one stream of typed events;
the console tree and the NDJSON are two renderers over it, and OpenTelemetry is just a third.
The event names are stable — run_started, node_started, node_progress, retry_scheduled,
node_completed — with the contract documented in docs/events.md. Fields are append-only:
future versions may add fields but never rename or remove one, so a script written against
today’s events keeps working. Ordering is guaranteed per node (started → progress* →
retry_scheduled* → completed, where * means zero-or-more); across nodes, interleaving is real
concurrency.
Bottom left: when a node fails. dbt semantics by default: the failed node fails, its
descendants are skipped (they can’t produce correct output without their input, so they’re
skipped rather than run wrong), and independent branches finish. --fail-fast cancels
everything instead, if you prefer. Exit codes let CI branch on the outcome: 0 = success, 1 = the
run completed but some nodes failed, 2 = the project itself is invalid, 3 = the engine hit
something unexpected.
Bottom right: checkpointing and retry. run_results.json — the machine-readable run
receipt — is rewritten after every node completes, not once at the end, so even a killed
process leaves an accurate record. The error shown carries pz’s usual anatomy: the file, a
stable code (PZ0501), and the actual cause.
pz retry re-runs only failed and skipped nodes. Succeeded nodes are skipped if their content
hash and upstream results are unchanged — the content-addressed node ID from the compile slide
paying off: “nothing changed” is provable, not assumed.
Retries come in three tiers, narrowest blast radius first, cleanly separated:
- Operation-level — for connectors that declare gated operations, the engine retries and
paces a single idempotent request, honoring the server’s
Retry-After, so one flaky HTTP call costs one request, never the whole node. - Node-level, in-run — the connector diagnoses the error (transient or permanent, via
IsTransient, optionally passing the server’s requested wait asRetryAfter); the engine owns the policy: attempts, exponential backoff plus jitter (wait longer after each attempt, with randomness so parallel nodes don’t all retry in sync). Connectors never retry internally — if they did, the layers would multiply: 5 engine attempts × 5 hidden connector attempts = 25 real calls. - Cross-run —
pz retryfor everything else.
Retries are safe by construction: a failed ingest drops its staging table before the error propagates, and a failed sink attempt aborts its write session (discarding temp-written data the destination never saw) — so a retried attempt never appends onto a half-done one.
The retry policy is layered: the engine-wide default can be overridden by a source or sink
instance’s own retry: block, and a single dataset or output can override that again — nearest
wins, so a millions-of-rows backfill next to a small lookup table can carry its own tuning.
Underneath retries sits a circuit breaker, per instance — a pattern from resilient-systems
design: after repeated failures, stop hammering the sick system entirely. failure_threshold
consecutive transient failures trip it from Closed (normal, traffic flows) to Open (all
work against that instance pauses for cool_down); after the cool-down, exactly one
Half-Open probe is admitted — success closes the breaker, failure reopens it for a fresh
cool-down. Two details matter: waiting on an open breaker costs wall-clock time but never
consumes a node’s own retry attempts, and a final give-up surfaces as a retryable error
(PZ0506), so the next pz retry picks the node back up once the instance recovers.
Key points
Section titled “Key points”- One event stream, many renderers — the console is just the default view.
- The run receipt is written as the run happens, not after it survives.
- The engine owns the retry policy; the connector owns the diagnosis.
- Failure is contained: descendants skip, independent branches finish, exit codes tell CI which kind of problem occurred.
Common questions
Section titled “Common questions”- What does Ctrl-C do? Graceful shutdown: stop dispatching, cancel nodes, abort sink sessions
(discarding temp-written data so destinations are untouched), finalize artifacts —
run_results.jsonstill gets written, so even an interrupted run leaves a usable receipt and is retryable. A second Ctrl-C forces exit. - Can I run just part of the DAG? Yes, with dbt’s selector syntax:
--select orders_enriched+(the+means “this node and everything downstream”),tag:daily,source:crm.*. - Are Pipeline nodes retried too? In practice no: their failures are plain SQL errors, not transient connector errors, so they fail straight through. Loads and sink writes are the retry candidates — and both are all-or-nothing per attempt.
Next: 05-resilience-and-resume — the failure story in full: containment tiers, what survives a failure, and the delivery guarantees.