01 — Overview: how a `pz` run works
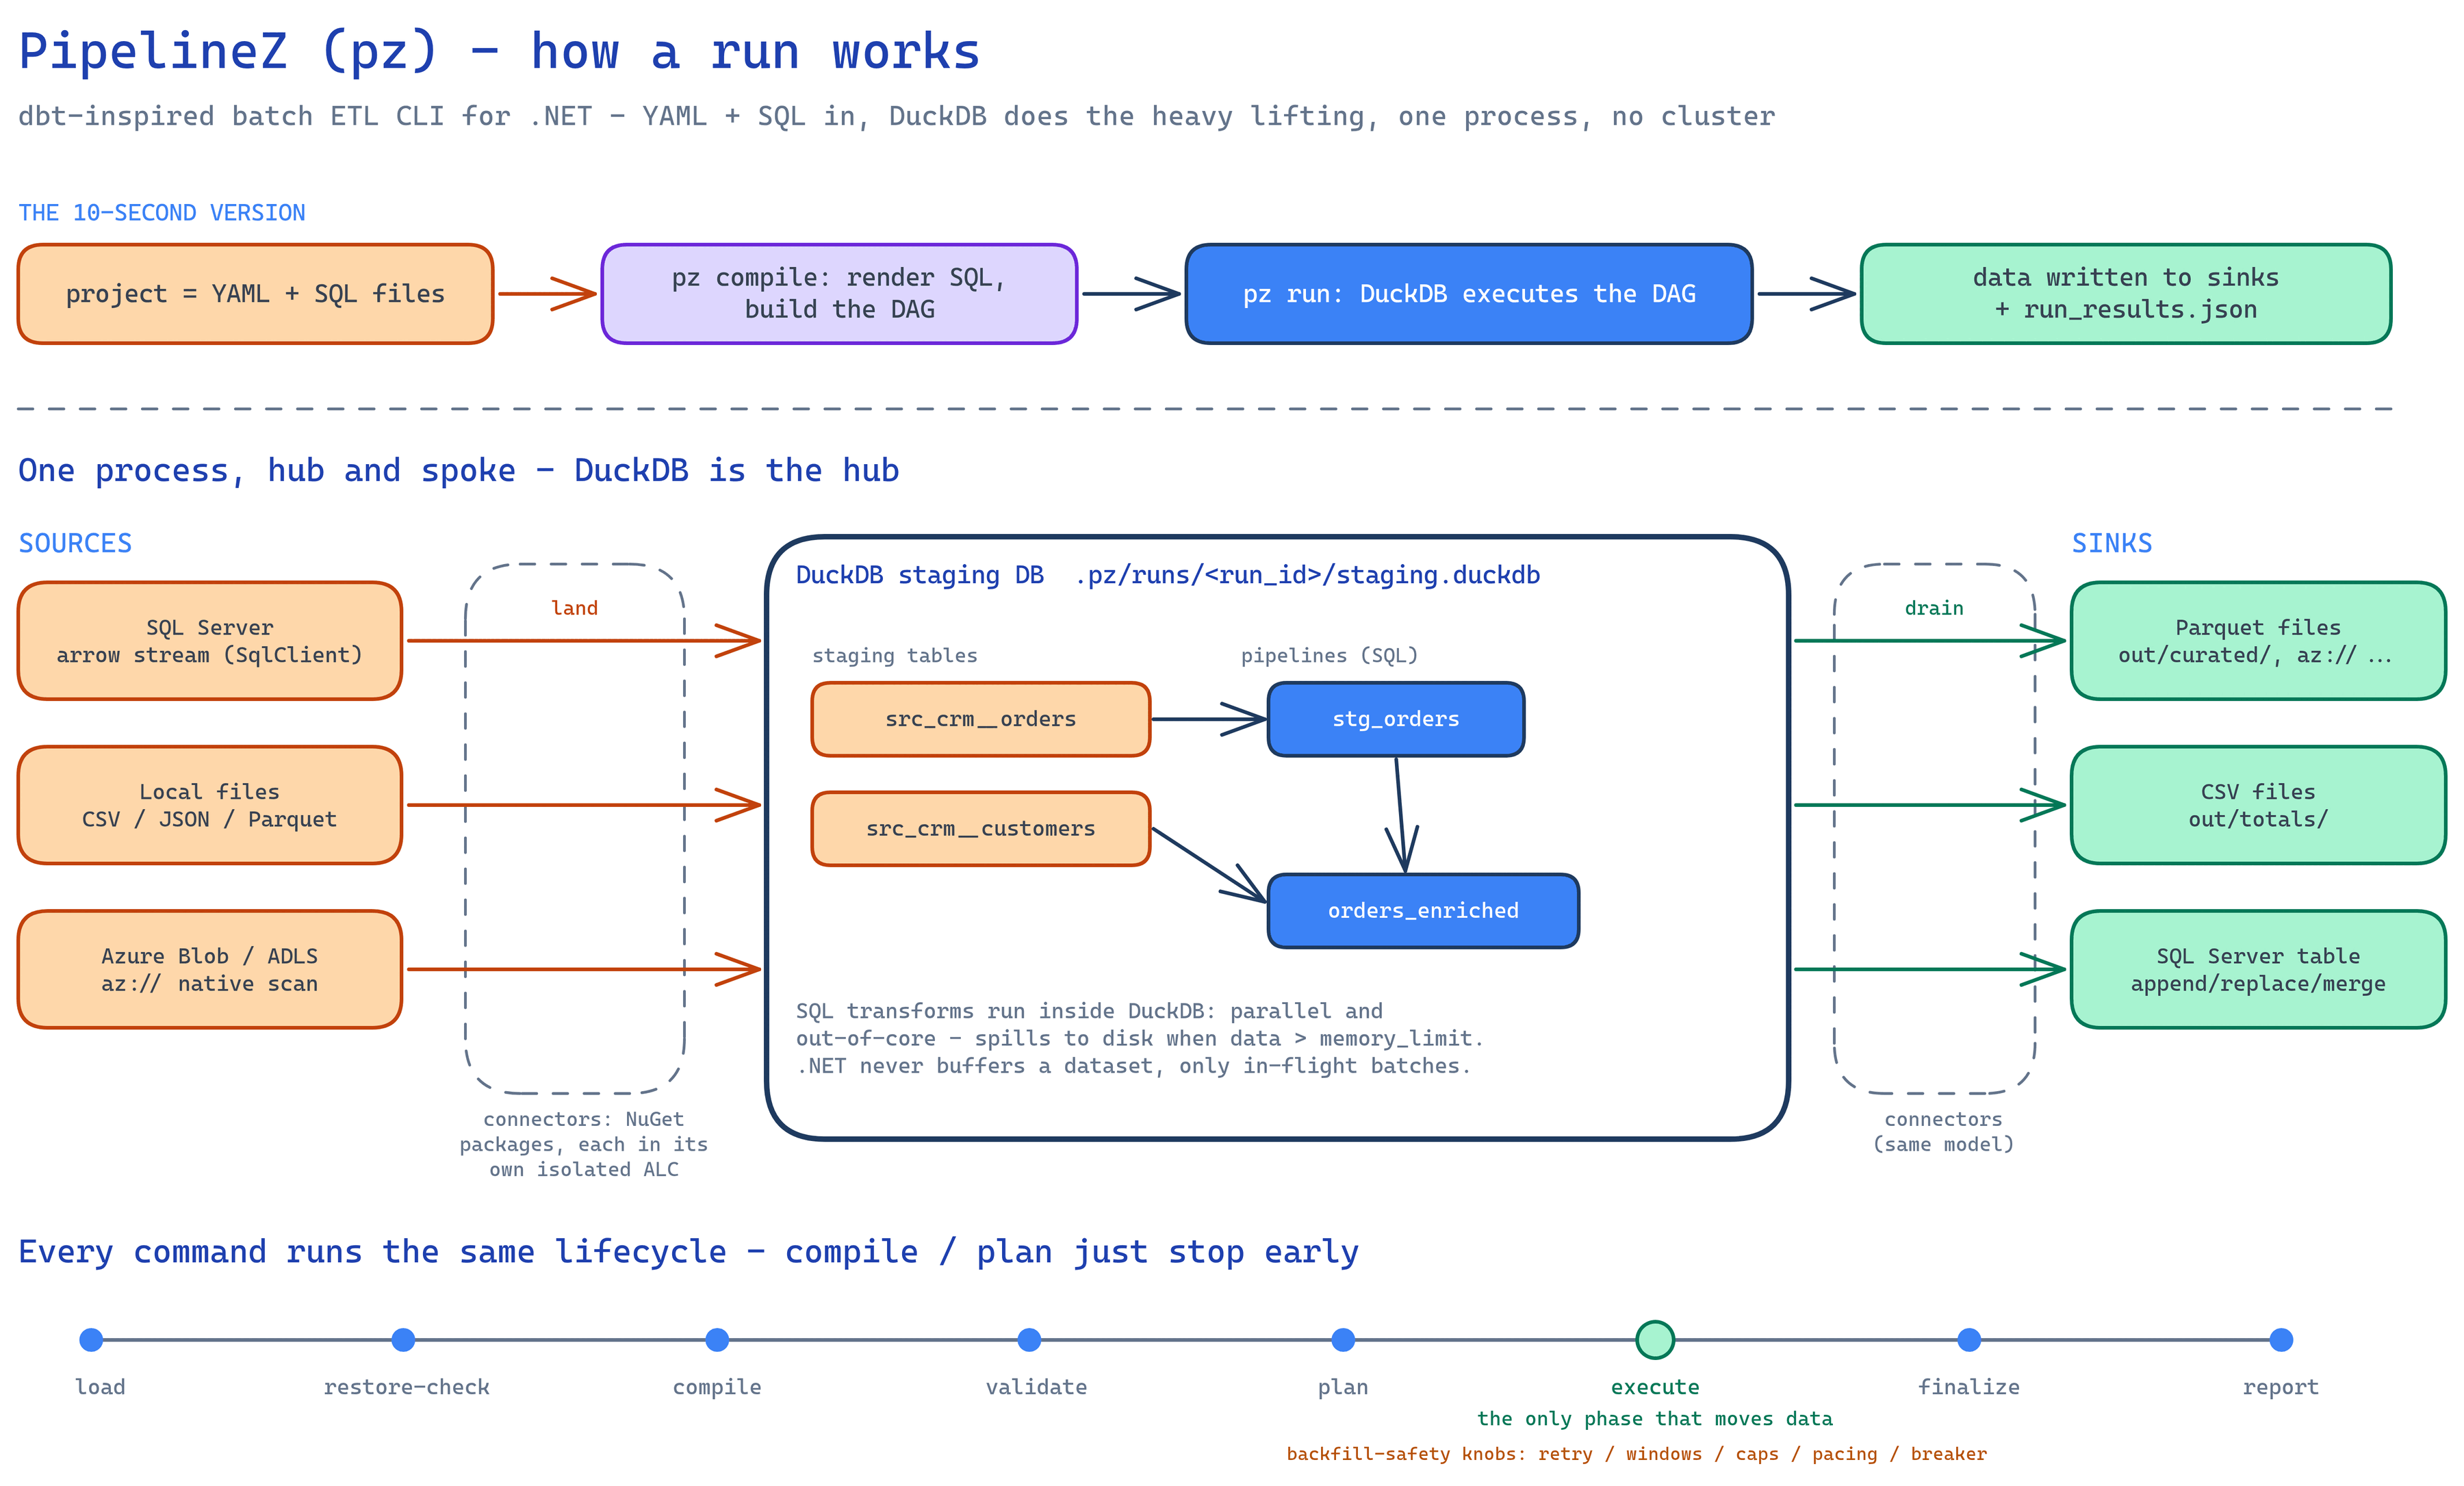
This diagram shows the whole machine on one page: a project of YAML and SQL files becomes a dependency graph, one command executes that graph with DuckDB doing the heavy lifting, and data plus a machine-readable receipt come out the other side.
A few terms, in case they’re new:
- dbt — the most widely used SQL transformation tool: analysts write plain
SELECTstatements plus a little templating, and dbt works out the order to run them in. Its limitation: it only transforms data that is already inside a data warehouse. - Data warehouse — a hosted analytical database (Snowflake, BigQuery, Redshift). Powerful, but a service you must run, pay for, and copy your data into first.
- DuckDB — an embedded analytical SQL database: think “SQLite for analytics”. A full columnar SQL engine that runs inside your process as a library — nothing to install or operate.
- ETL — extract, transform, load. PipelineZ does all three; dbt only does the T.
- DAG — directed acyclic graph: a dependency graph with no cycles. Arrows point from what must run first to what depends on it; anything not connected can run in parallel.
If you know dbt: PipelineZ keeps the experience — SQL files, ref() templating, a compiled DAG
you can inspect before running — but swaps the warehouse for an embedded DuckDB and the Python
runtime for one self-contained .NET CLI called pz. If you don’t know dbt: you write SQL files
and a bit of YAML config; the tool figures out what depends on what and runs it in the right
order. That’s the whole authoring model.
Reading the diagram
Section titled “Reading the diagram”The top strip is the 10-second version, left to right. A project is just YAML and SQL files
in git — nothing else. The YAML files declare where data comes from and where it goes; the SQL
files say how to transform it. pz compile renders the SQL and builds a dependency DAG without
executing anything (“renders” means it fills in the templates: every ref()/source()/sink()
call is resolved to a real table name, and each call also records a dependency edge). pz run
executes that DAG, and DuckDB does the actual work. Out the other side: your data at the
destinations, plus run_results.json — the machine-readable receipt. CI systems and
orchestrators (a build server like GitHub Actions, a job scheduler like Airflow) parse that file
to decide what to do next instead of scraping console output.
The middle is the architectural core: hub and spoke. The center box is one DuckDB staging
database per run, on disk, under .pz/runs/. Sources land data into it, SQL pipelines
transform inside it, and sinks drain results out of it. A source is a system data is
pulled from; a sink is a destination data is written to; a pipeline is one SQL
transformation step; the staging database is a scratch SQL database created fresh for each run —
the hub. The mini-flow inside the hub (src_crm__orders → stg_orders → orders_enriched)
uses the sample project that diagram 02 dissects.
Because staging is disk-backed DuckDB, larger-than-memory data just works: sorts and joins spill
to disk under DuckDB’s memory_limit instead of crashing (called out-of-core processing). The
.NET host never buffers a dataset — it only ever holds a few in-flight batches, the small chunks
of rows currently in transit, a few tens of MB regardless of dataset size.
The source boxes show real systems: SQL Server, local files, Azure Blob/ADLS (ADLS = Azure Data
Lake Storage, Azure’s filesystem-flavored blob storage). The small print matters: local files
and Azure ride DuckDB native scans by default — DuckDB reads the storage directly and the
bytes never pass through .NET at all. Azure goes through pz’s own builtin azureblob connector
and DuckDB’s azure extension (an extension is a loadable plugin inside DuckDB itself, e.g. one
that can read az:// URLs); the same connector also has a universal tier over the Azure Storage
SDK for the cases where force_universal applies. SQL Server streams Arrow batches over
SqlClient — the universal tier, its only tier today. Diagram 03 explains exactly what the two
tiers mean.
The dashed bands around sources and sinks are connectors — the plugins that teach pz to talk to one kind of external system. They are ordinary NuGet packages (NuGet is the .NET package manager, like npm for .NET), each loaded into its own isolated AssemblyLoadContext — .NET’s mechanism for giving a plugin a private sandbox for its dependencies, the same idea as separate classloaders in Java. Two connectors can depend on different versions of the same library — say two SqlClient majors — and never conflict.
The bottom timeline is the lifecycle. Every verb runs the same eight phases — compile and
plan just stop early: load the project files, check restored packages, compile the templates,
validate (including having DuckDB dry-check every query), plan how data will move, execute,
finalize artifacts, report. Execute — the green dot — is the only phase that moves data.
Everything before it is designed to kill the run cheaply: a project that compiles and validates
is very likely to execute, and most mistakes die in seconds instead of mid-run.
Key points
Section titled “Key points”- DuckDB is the hub; everything else is plumbing to and from it.
- One process, no cluster: it runs the same on a laptop and in a plain CI job.
- dbt’s ergonomics without dbt’s warehouse.
- Data bigger than RAM is DuckDB’s problem, not yours — staging is disk-backed and spills.
Common questions
Section titled “Common questions”- Why not just use dbt? dbt transforms data already in a warehouse. PipelineZ moves data — files, SQL Server, Azure storage — with the transform engine embedded. No warehouse, no Python runtime, one self-contained dotnet tool a .NET team already knows how to install.
- How does this deploy in an Azure shop? The CLI is already a self-contained batch job: container image + project mount + environment secrets. An Azure Container Apps job (Azure’s serverless container runner) or an Azure Data Factory custom activity wraps it directly, and metrics/traces already speak OpenTelemetry — the vendor-neutral observability standard most monitoring backends ingest.
- What about streaming and scheduling? Explicit non-goals for now. Runs are batch — they
process a finite chunk of data and exit — and they compose with Airflow/Dagster/cron via exit
codes and
run_results.json, the same way dbt does. (An exit code is the number a process returns — 0 for success — which is all a scheduler needs to sequence jobs.) - What if my data is bigger than RAM? That’s the disk-backed staging point: DuckDB spills and uses out-of-core operators. The host’s memory stays small and predictable.
Next: 02-compile-dag — how YAML and SQL files become that DAG.