A code tour for new contributors
This page is for someone who understands what PipelineZ does but gets lost in the code.
It follows one pz run from the keystroke to the output files, step by step, naming the
actual classes and files at every stop, using the sample project that pz init --template sample creates as
the running example. No prior knowledge of the internals is assumed.
If you haven’t used pz yet, do the quickstart first — this tour is much
easier to follow after you’ve run it once. The vocabulary lives in
Key concepts; this page repeats the important bits in place so you don’t
have to jump around.
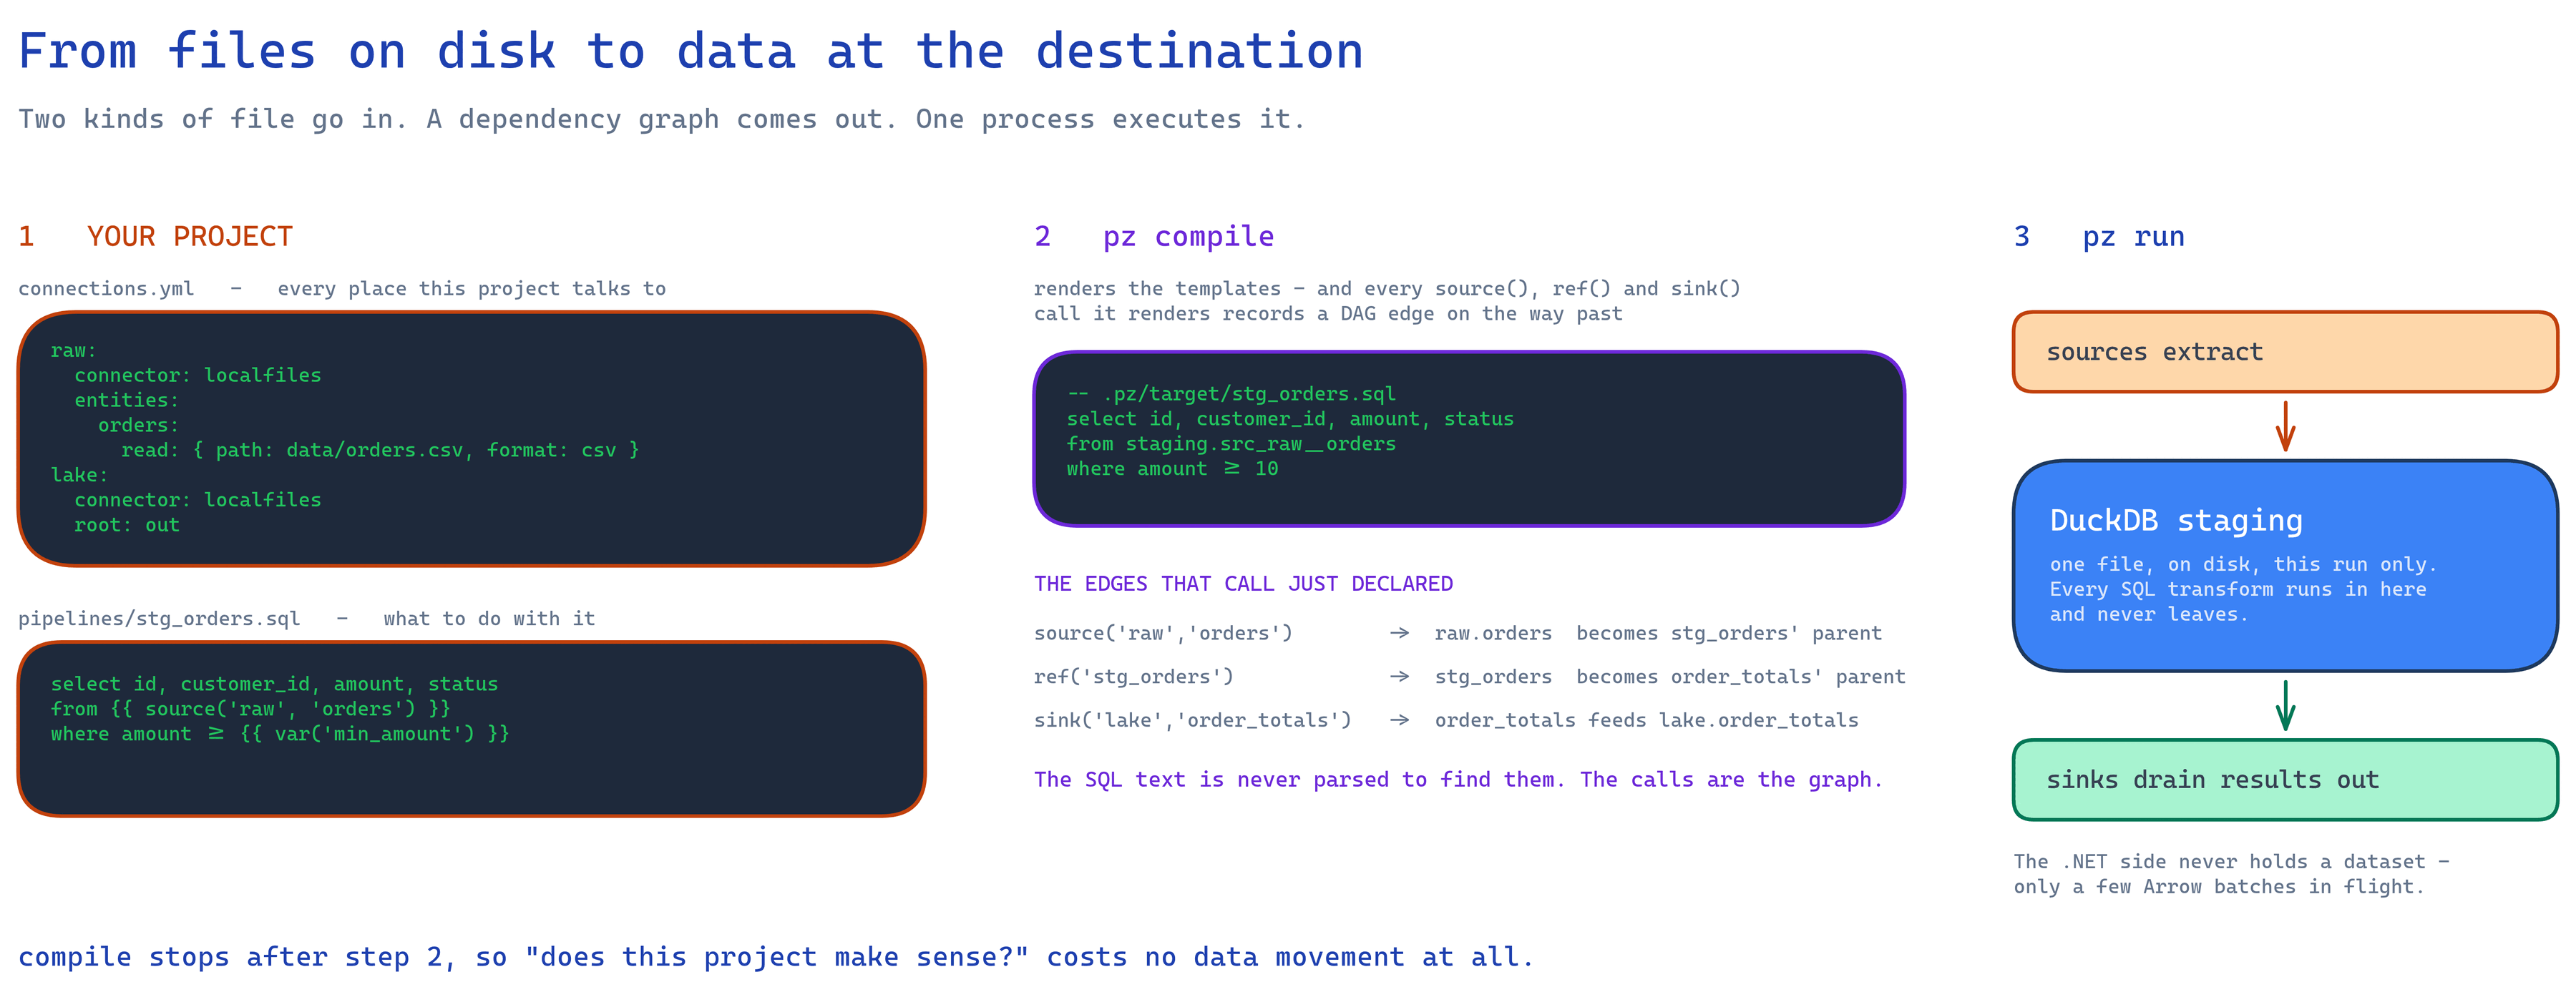
1. The mental model in 30 seconds
Section titled “1. The mental model in 30 seconds”PipelineZ is a build tool for data, the way make or dbt are build tools for code:
- You describe your data in small files: YAML for “where data comes from” (sources) and “where results go” (sinks), SQL for “how to transform it” (pipelines).
pzcompiles those files into a dependency graph — “load orders before you can filter them, filter them before you can total them” — and figures out the correct order itself.pzexecutes that graph using an embedded DuckDB database as the workbench: sources land raw data into DuckDB, your SQL runs inside DuckDB, sinks drain the results out of DuckDB.
That’s the whole machine. Everything else in the codebase is making those three steps safe, fast, observable, and resumable.
2. The example project
Section titled “2. The example project”Running pz init my-project --template sample scaffolds this:
my-project/├── project.yml # project name, connectors, vars, engine settings├── connections.yml # every place pz talks to, and each one's entities├── pipelines/│ ├── stg_orders.sql # transform: filter raw orders│ ├── orders_enriched.sql # transform: join orders with customers → sink│ ├── order_totals.sql # transform: aggregate → sink│ ├── product_catalog.sql # transform: passthrough → sink│ └── configs/│ └── orders_enriched.yml # per-pipeline options: materialization, checks├── data/ # CSVs so the example runs offline├── .gitignore # keeps .pz/ and out/ out of version control└── README.md # what this template is and what to run nextWalk through each file:
connections.yml declares every place pz talks to. A connection has a connector (the
plugin that knows how to talk to a kind of system — here localfiles, which reads local
CSV/Parquet/NDJSON) and entities (the individual tables/files it exposes). Direction is the function
a pipeline calls, not the block you declared, so one connection can be both read and written:
raw: connector: localfiles entities: orders: read: path: data/orders.csv format: csv columns: id: bigint customer_id: bigint amount: double status: varcharpipelines/stg_orders.sql is a transformation. It is plain SQL plus a few
double-brace template calls:
select id, customer_id, amount, statusfrom {{ source('raw', 'orders') }}where amount >= {{ var('min_amount') }}Those {{ ... }} calls are the most important idea in the whole project, so read this twice:
the template calls are how pz learns the dependency graph. pz never parses your SQL
to guess what it reads. When it renders this file, the call source('raw', 'orders')
does two jobs at once: it returns the name of the table the data will be in, and it
records “this pipeline depends on the orders dataset of source raw”.
| Template call | Plain meaning | Renders to |
|---|---|---|
{{ source('raw', 'orders') }} |
“I read this source dataset” | the staging table the source lands into |
{{ ref('stg_orders') }} |
“I read that other pipeline’s output” | the staging table/view that pipeline produces |
{{ sink('lake', 'order_totals') }} |
“my result feeds this sink output” | (declares the edge; the compiler handles the rest) |
{{ var('min_amount') }} |
“paste in this project variable” | the value from project.yml vars: (here 10) |
pipelines/order_totals.sql shows the sink call — a pipeline can read like one
complete extract-transform-load statement:
INSERT INTO {{ sink('lake', 'order_totals') }}select customer_id, sum(amount) as totalfrom {{ ref('stg_orders') }}group by customer_idNote there is no INSERT at run time — the compiler strips the INSERT INTO {{ sink(...) }}
wrapper and keeps only the select. Execution is always “materialize the select into a
staging table, then a separate step drains that table into the sink” (see §6). The inline
form is sugar for declaring the pipeline→sink edge in one readable file.
pipelines/configs/orders_enriched.yml carries per-pipeline options that don’t belong in
SQL — how to materialize, and data-quality checks:
pipeline: orders_enrichedmaterialization: tabletags: [daily]checks: - not_null: [id, email] - unique: [id]The lake connection is where results go — just a place with credentials. What to write and
how (strategy, keys, format, path) rides the sink() call in the pipeline that writes it,
or an entities: <e>: write: block here — never both (PZ0341).
3. The map of the code
Section titled “3. The map of the code”The solution is layered, and the layering is strict: each project may only reference the ones below it. If you remember one rule about where code lives, remember this diagram:
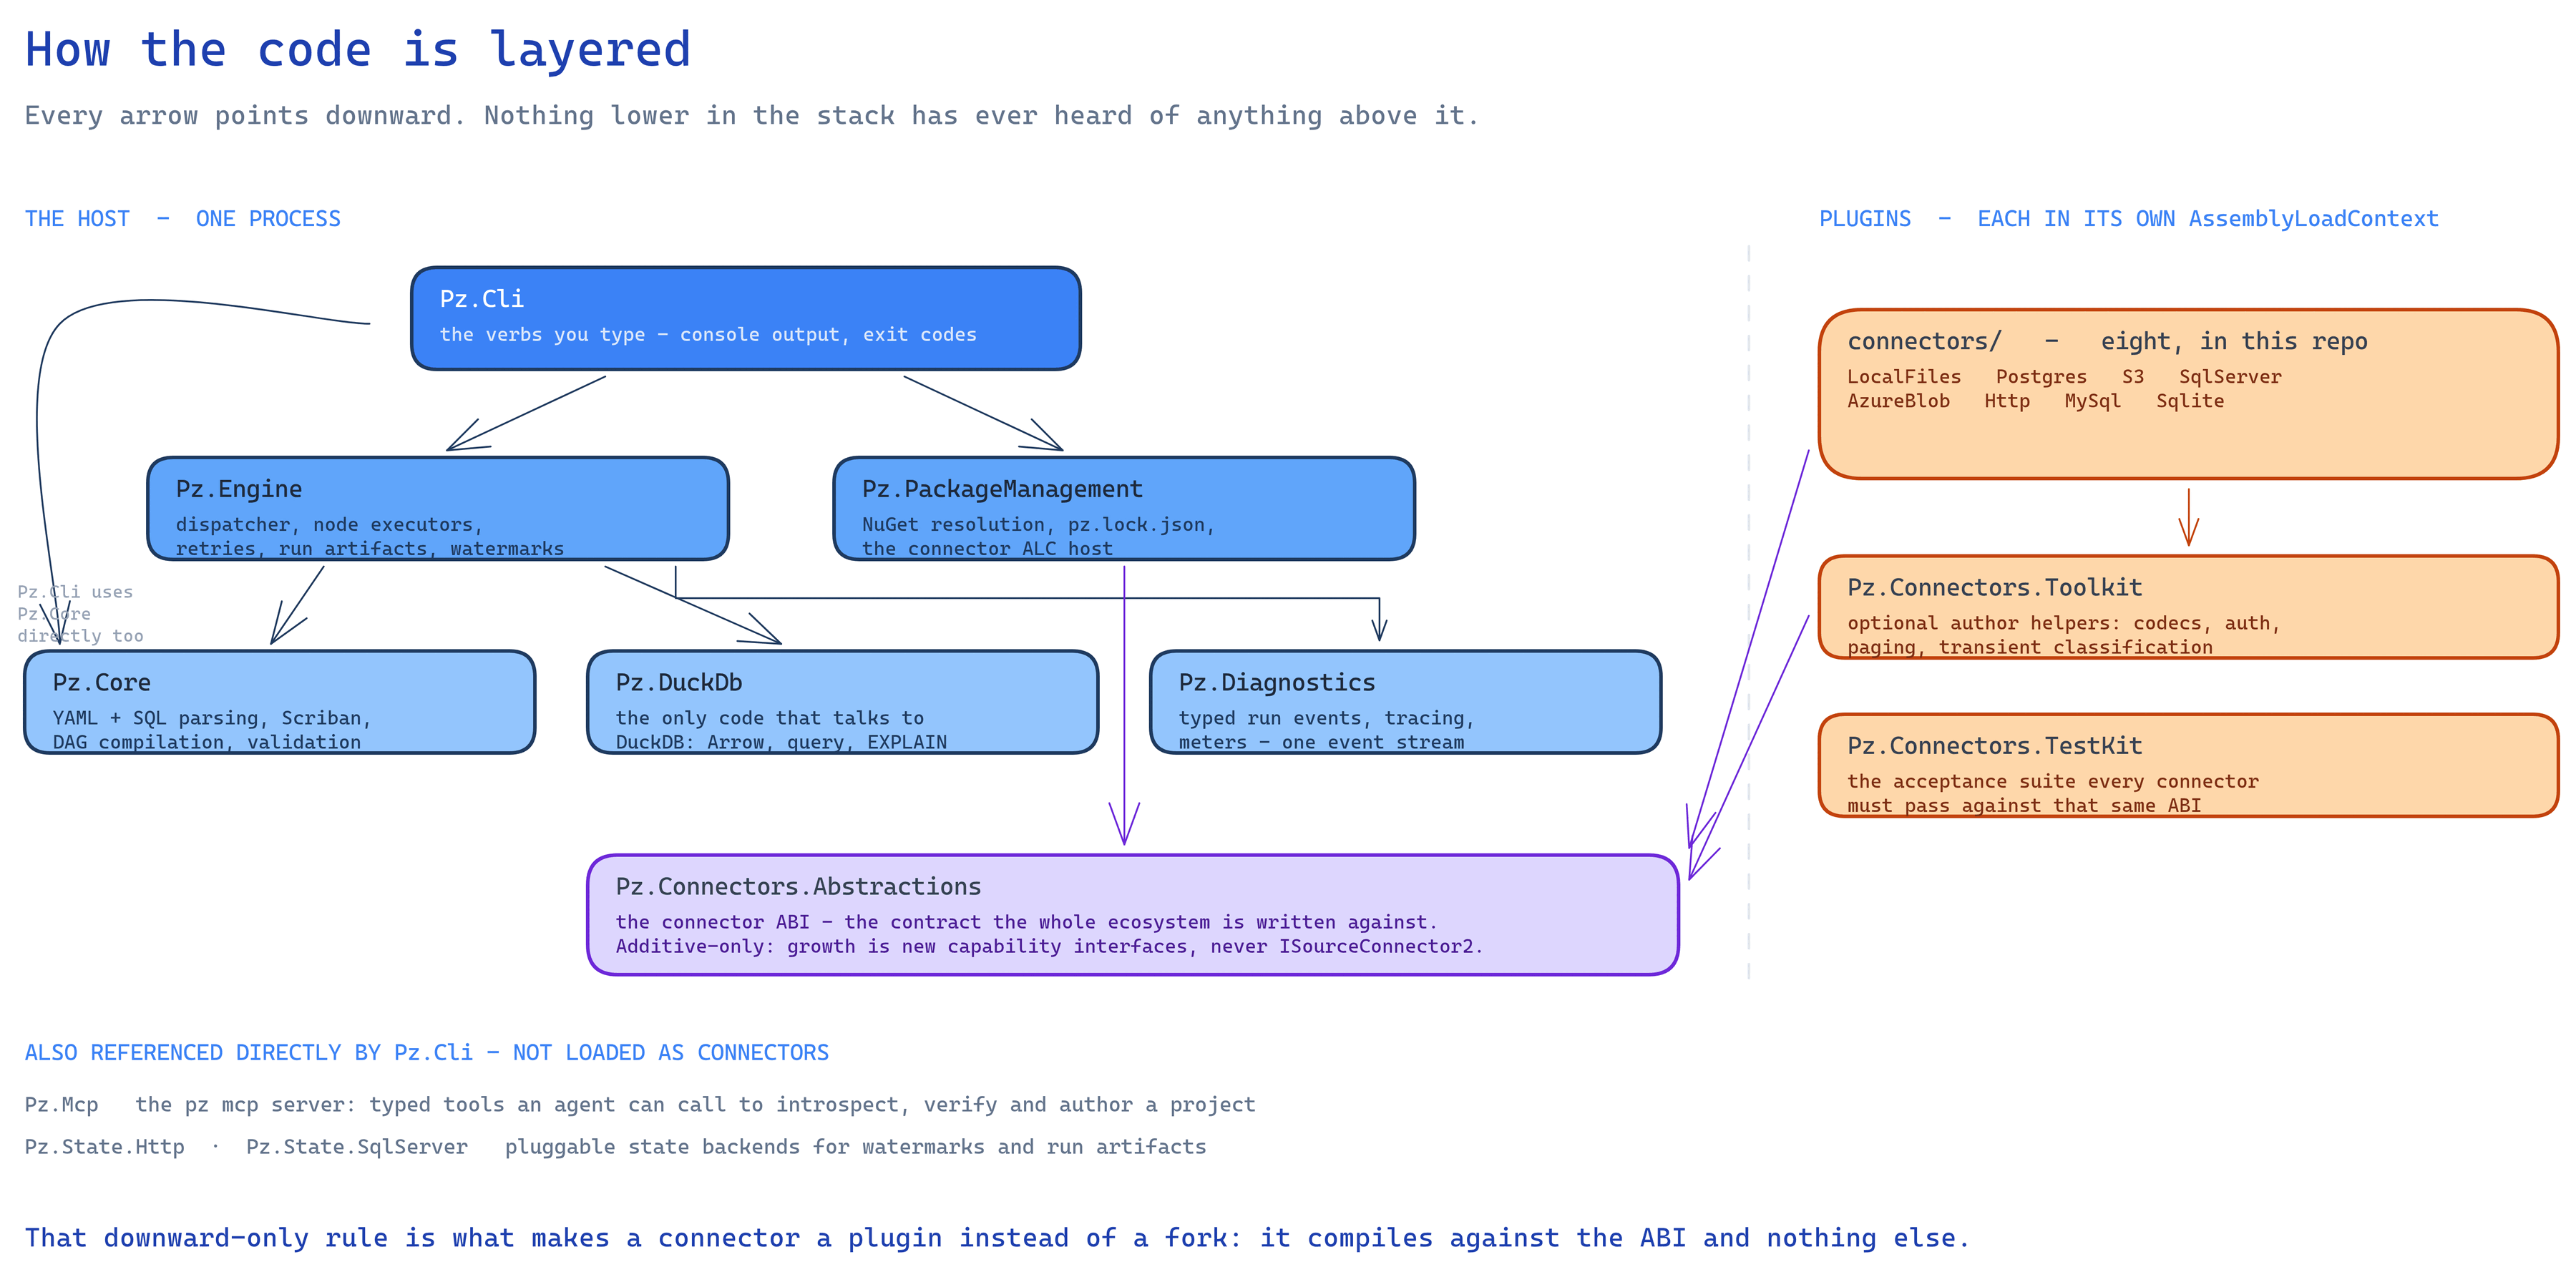
In plain terms:
| Project | One-line job | Start reading at |
|---|---|---|
src/Pz.Cli |
Defines each verb, parses arguments, prints output, returns exit codes. Thin — real work is delegated down. | Commands/RunCommand.cs |
src/Pz.Core |
Turns files on disk into an in-memory PzProject, renders SQL templates, builds the DAG. Knows nothing about executing. |
Loading/ProjectLoader.cs, Dag/DagCompiler.cs |
src/Pz.Engine |
Runs a compiled DAG: dispatches nodes, moves data, retries failures, writes run artifacts. | Dispatch/RunOrchestrator.cs, Execution/ |
src/Pz.DuckDb |
Wraps the DuckDB native library behind an interface. Nothing else in the repo touches DuckDB directly. | DuckSession |
src/Pz.PackageManagement |
Resolves connector NuGet packages, writes pz.lock.json, loads each connector into its own isolated plugin context. |
Hosting/, Restore/ |
src/Pz.Connectors.Abstractions |
The interfaces every connector implements (ISourceConnector, ISink, …). The contract of the ecosystem — changes here are additive-only. |
the interfaces themselves |
src/Pz.Diagnostics |
One typed event stream that both the console renderer and the NDJSON log are views of, plus OpenTelemetry plumbing. | Events/RunEvent.cs |
connectors/ |
The first-party connectors, each also a worked example of the ABI. | connectors/Pz.Connector.LocalFiles |
4. Every command walks the same eight phases
Section titled “4. Every command walks the same eight phases”Every verb runs the same rails and just stops at a different station:
load → restore-check → compile → validate → plan → execute → finalize → reportpz compilestops after compile (writes.pz/target/manifest.json).pz planstops after plan (writes.pz/target/plan.json).pz validateruns the validation tiers and stops.pz run(andpz test,pz retry) go all the way to report.
This is why the codebase feels repetitive at the top of each *Command.cs file — every verb
begins with the same ProjectLoader.Load(...) → DagCompiler.Compile(...) prelude. That
repetition is the design: one set of rails, verbs differ only in how far they ride them.
5. Phase by phase: what happens when you type pz run
Section titled “5. Phase by phase: what happens when you type pz run”The rest of this tour follows pz run in the example project. The orchestrating code is
RunCommand.ExecuteRun in src/Pz.Cli/Commands/RunCommand.cs — it is long but linear, and
reads exactly in the order below.
Phase 1: load — files become a PzProject
Section titled “Phase 1: load — files become a PzProject”ProjectLoader.Load (src/Pz.Core/Loading/ProjectLoader.cs) reads project.yml,
connections.yml, and every file under pipelines/, and turns them into one immutable in-memory
record: PzProject. Environment variables are interpolated, vars: defaults are applied.
If anything is wrong — unknown key, missing required field, bad duration string — loading
does not stop at the first problem. Errors are collected and thrown together as a
PzValidationException holding a list of PzErrors, each with a stable PZ#### code, the
file it came from, and a suggested next step. You’ll see this “aggregate, never
fail-one-at-a-time” pattern everywhere; it’s a project-wide rule.
Phase 2: restore-check — are the connectors here?
Section titled “Phase 2: restore-check — are the connectors here?”Connectors are plugins. The seven first-party ones (LocalFiles, Postgres, S3, SqlServer,
AzureBlob, Http, MySql) are built into the pz tool itself; third-party ones are NuGet packages that
pz restore downloads into .pz/packages and pins in pz.lock.json.
ConnectorRegistryFactory.CreateAsync checks that every connector the project declares is
available and loads each non-builtin one into its own AssemblyLoadContext — think “a
private classloader per plugin”, so one connector’s dependency versions can never clash with
another’s or with the engine’s. The result is a ConnectorRegistry the engine can ask for
connector instances by name.
Phase 3: compile — files become a graph
Section titled “Phase 3: compile — files become a graph”DagCompiler.Compile (src/Pz.Core/Dag/DagCompiler.cs) is the heart of Pz.Core. For the
example project it:
-
Renders every pipeline’s SQL with the Scriban template engine (sandboxed — only the whitelisted functions from §2 exist). Rendering
stg_orders.sqlproduces real SQL:select id, customer_id, amount, statusfrom staging.src_raw__orderswhere amount >= 10and, as a side effect, records the dependency “stg_orders needs source raw.orders”.
-
Builds nodes. There are exactly four node kinds, and every run is made only of these:
Node kind Plain meaning Executed by SourceLoad“land dataset X of source Y into a staging table” SourceLoadExecutorPipeline“run this rendered SQL inside DuckDB” PipelineExecutorCheck“run this assertion query; fail if it finds bad rows” CheckExecutorSinkWrite“drain that staging table into sink output Z” SinkWriteExecutor -
Gives every node a stable, content-addressed ID — a hash of what the node is, not when it was compiled. Same inputs, same ID, every time. This is what lets
pz retryand incremental watermarks recognize “the same node” across runs. -
Topologically sorts the nodes (Kahn’s algorithm,
TopologicalSortOrThrow) so dependencies always come before dependents, with deterministic tie-breaking. If yourref()calls form a loop, this is where you get thedependency cycle: a -> b -> aerror instead of a hang.
The compiled DAG for the example project looks like this (this is what pz compile +
.pz/target/manifest.json describe):
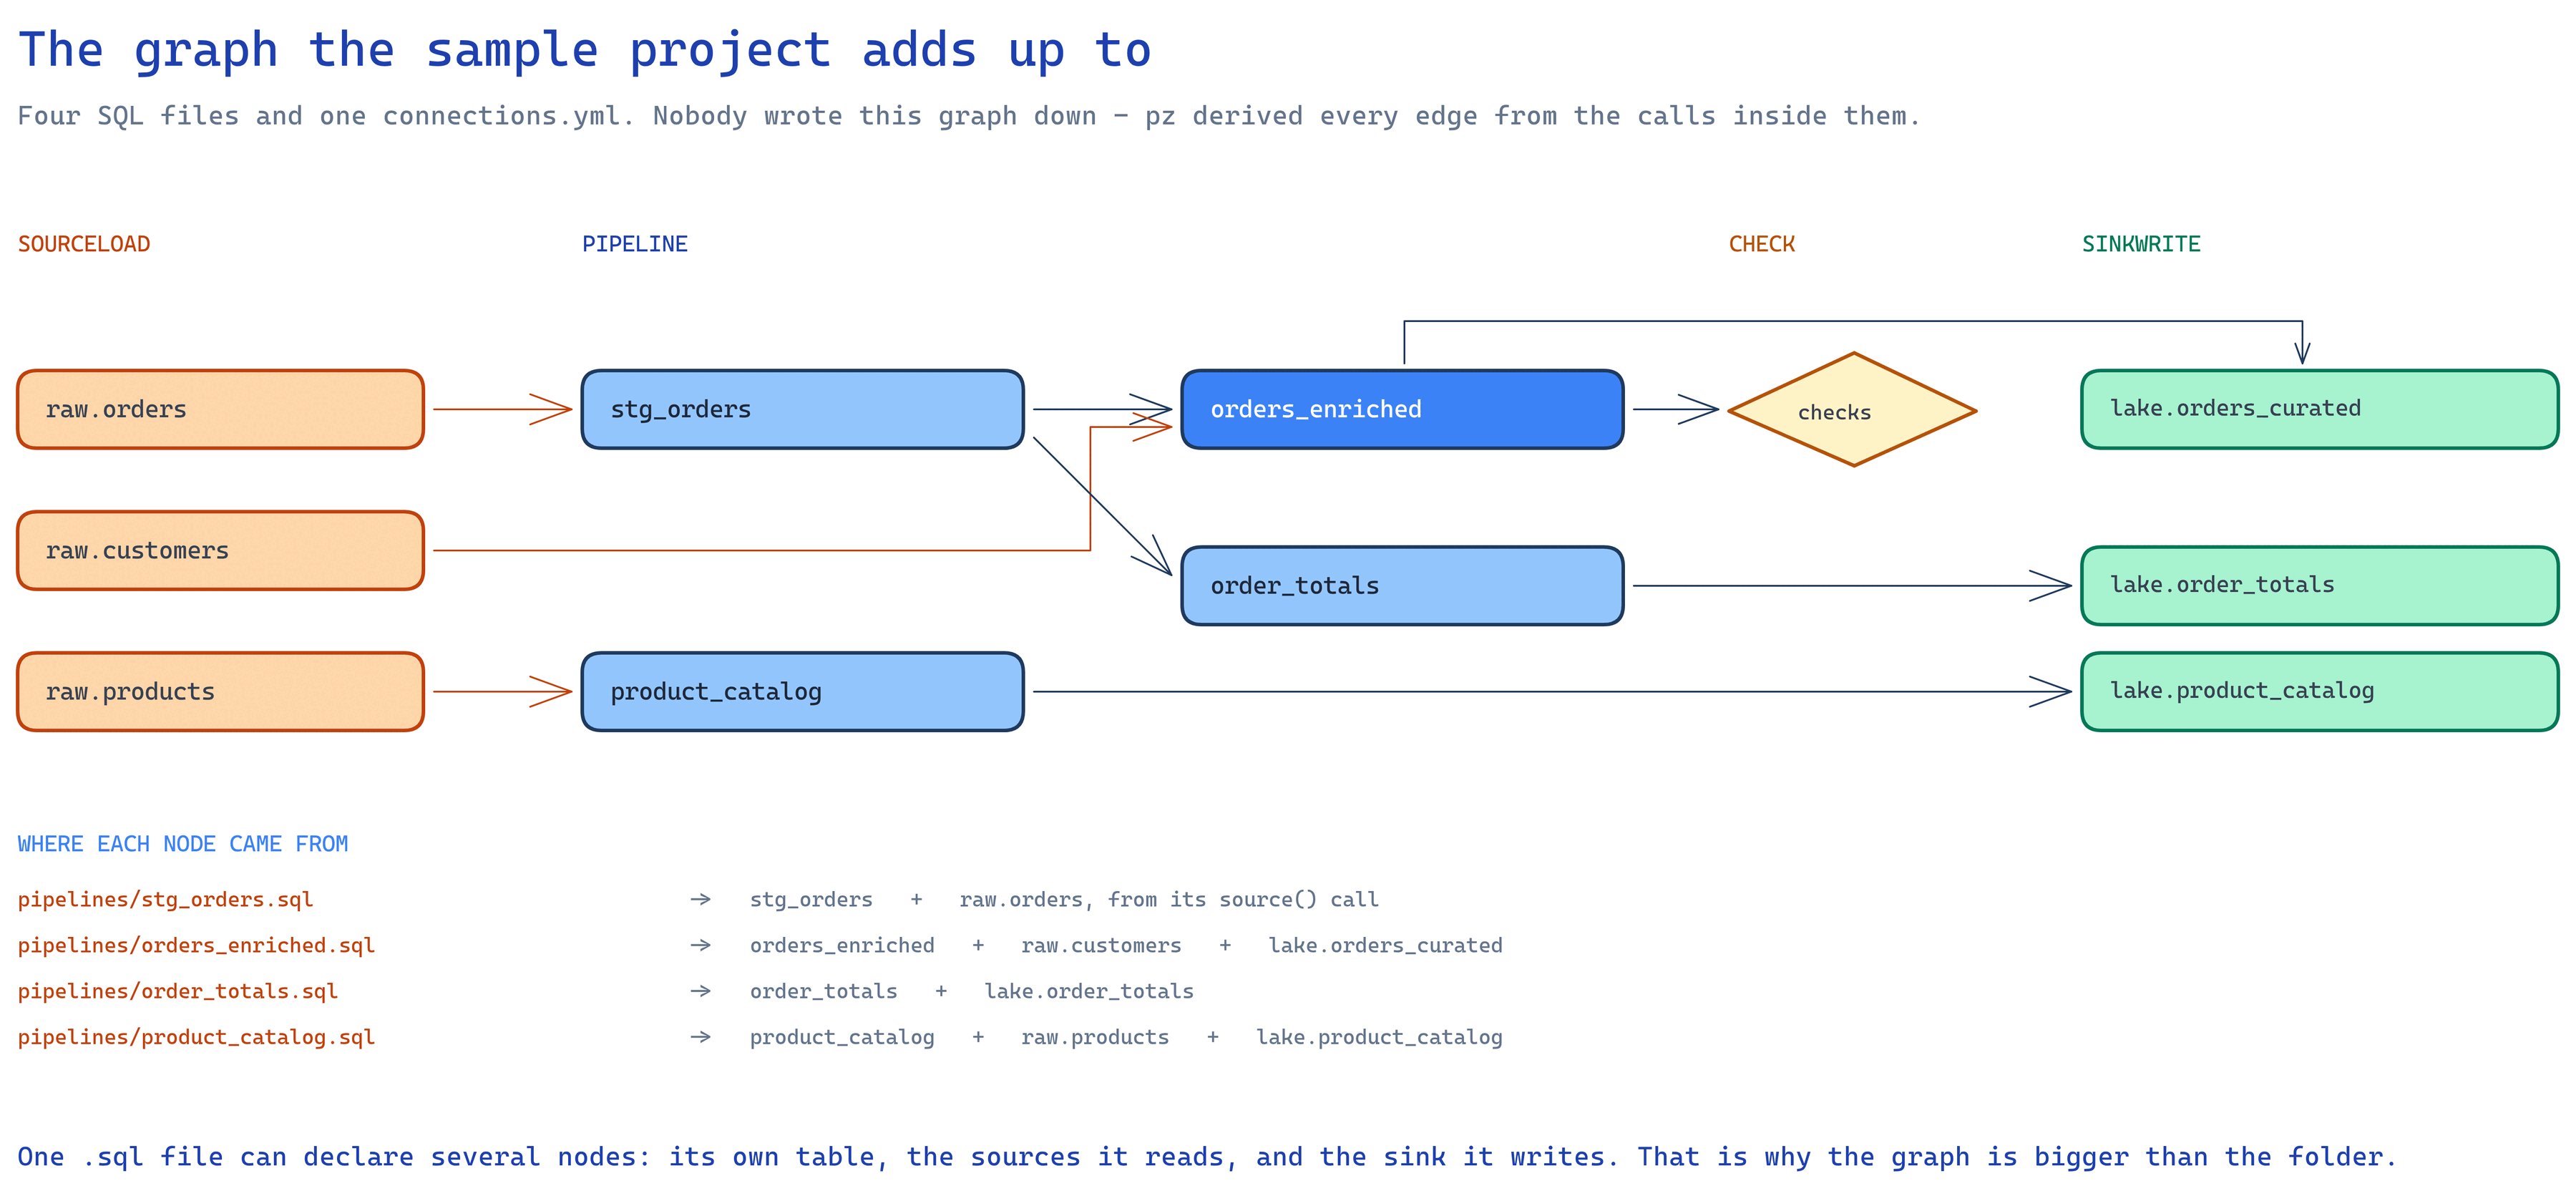
Note what created every arrow: a source(), ref(), or sink() call in a .sql file, or a
checks: entry in a config file. Nothing else.
Phase 4: validate — catch problems before moving any data
Section titled “Phase 4: validate — catch problems before moving any data”pz validate (and pz run on its way through) checks in tiers, cheapest first: YAML shape,
then compile/graph coherence, then each connector validates its own config, then the
SQL dry-compile — every rendered pipeline is EXPLAINed against empty tables built from
the declared column types, so DuckDB itself catches typos, unknown columns, and type errors
without touching a single data row. See Validation and errors for the full
tier list.
Phase 5: plan — decide how each edge moves data
Section titled “Phase 5: plan — decide how each edge moves data”Here’s a fact that surprises most people reading the code: there are two different ways
data physically moves, and ExecutionPlanner (src/Pz.Engine/Planning/) picks one per
edge:
Strategy (as shown by pz plan) |
Plain meaning |
|---|---|
native_scan |
The connector hands DuckDB a SQL fragment like read_csv('data/orders.csv') and DuckDB reads the data itself. The bytes never pass through .NET at all. Fastest. |
native_copy |
Same idea on the way out: DuckDB’s COPY statement writes the output file directly. |
arrow_stream |
The universal fallback: the connector streams the data through .NET as Arrow record batches (see §7). Works for any connector. |
duck_sql |
The edge is just SQL inside DuckDB (pipeline reading a staging table). |
Run pz plan in the example project and you’ll see each node’s chosen strategy and the
reason why — the planner never decides silently. The same table is persisted to
.pz/target/plan.json, along with a computed memory budget, so “how much RAM does this run
need” has an answer before anything runs.
Phase 6: execute — the graph actually runs
Section titled “Phase 6: execute — the graph actually runs”This is the biggest phase; it gets its own section (§6).
Phase 7: finalize — write down what happened
Section titled “Phase 7: finalize — write down what happened”Two artifacts matter:
.pz/runs/<run-id>/run_results.json— one entry per node: status, rows moved, duration, error if any. It is written incrementally after every node completes (SnapshotRunEvents→RunResultsWriter), not once at the end — so even if the process is killed mid-run,pz retrycan see exactly which nodes had finished..pz/state/watermarks.json— the incremental-load bookmarks (§8). Deliberately the very last write of the run.
The staging database outlives the run — every run, success or failure. That’s what pz retry
copies already-landed source tables back out of, so the source system isn’t contacted twice for
data it already delivered. Automatic retention (retention: in project.yml, on by default at
keep_last: 10) deletes staging.duckdb from runs past that window at the end of every run,
staging-only — run_results.json is always kept. Set retention: off to disable it.
pz clean remains the on-demand verb, and the only way to purge whole run
directories or select by age; it too keeps the newest run’s staging so pz retry stays usable.
Phase 8: report — the summary and exit code
Section titled “Phase 8: report — the summary and exit code”One summary line —
run 20260716T091500123Z-3f2a: 9 succeeded, 0 failed, 0 skipped (.pz/runs/.../run_results.json)cleaned 3 staging database(s) and 0 stale workdir(s) — freed 1.2 GBThe cleaned … line is automatic retention reporting what it swept (§7 above).
— and an exit code with fixed meaning: 0 all good, 1 some nodes failed, 2 your config/SQL is invalid (nothing ran), 3 fatal (crash or cancellation). Scripts and CI can branch on these.
6. Inside execute: the dispatcher and the four executors
Section titled “6. Inside execute: the dispatcher and the four executors”The staging database
Section titled “The staging database”The first thing ExecuteRun does is create the run directory and open the hub:
.pz/runs/<run-id>/staging.duckdbDuckSession.Open(...) opens that file and creates a schema named staging in it. Every
intermediate table of the run lives there, on disk (so datasets bigger than RAM are fine —
DuckDB spills), named predictably (StagingNames in SinkWriteExecutor.cs):
- a source landing:
staging.src_raw__orders - a pipeline’s output:
staging.stg_orders
One detail worth knowing early because it’s counterintuitive: the whole run shares one
DuckDB connection, serialized by a SemaphoreSlim. Parallelism does not come from parallel
connections — it comes from the dispatcher overlapping different kinds of work (one node
extracting from Postgres while another writes Parquet while DuckDB crunches a third).
The dispatcher
Section titled “The dispatcher”RunOrchestrator.ExecuteAsync (src/Pz.Engine/Dispatch/RunOrchestrator.cs) is an
event-driven dispatcher, not a loop. In plain terms:
- Every node knows how many dependencies it’s still waiting for (a counter).
- All nodes with counter 0 start immediately (up to
engine.threadsat once — a globalSemaphoreSlimis the ticket booth). - When a node finishes successfully, it decrements each child’s counter; any child that hits 0 is dispatched right then.
- When a node fails, every descendant is marked
Skipped(CascadeSkip) — never run on top of missing input. Siblings elsewhere in the graph keep running (unless--fail-fast). - When the outstanding-work counter drains to zero, the run is over; every node in the run
is guaranteed to end with exactly one result:
Success,Failed, orSkipped.
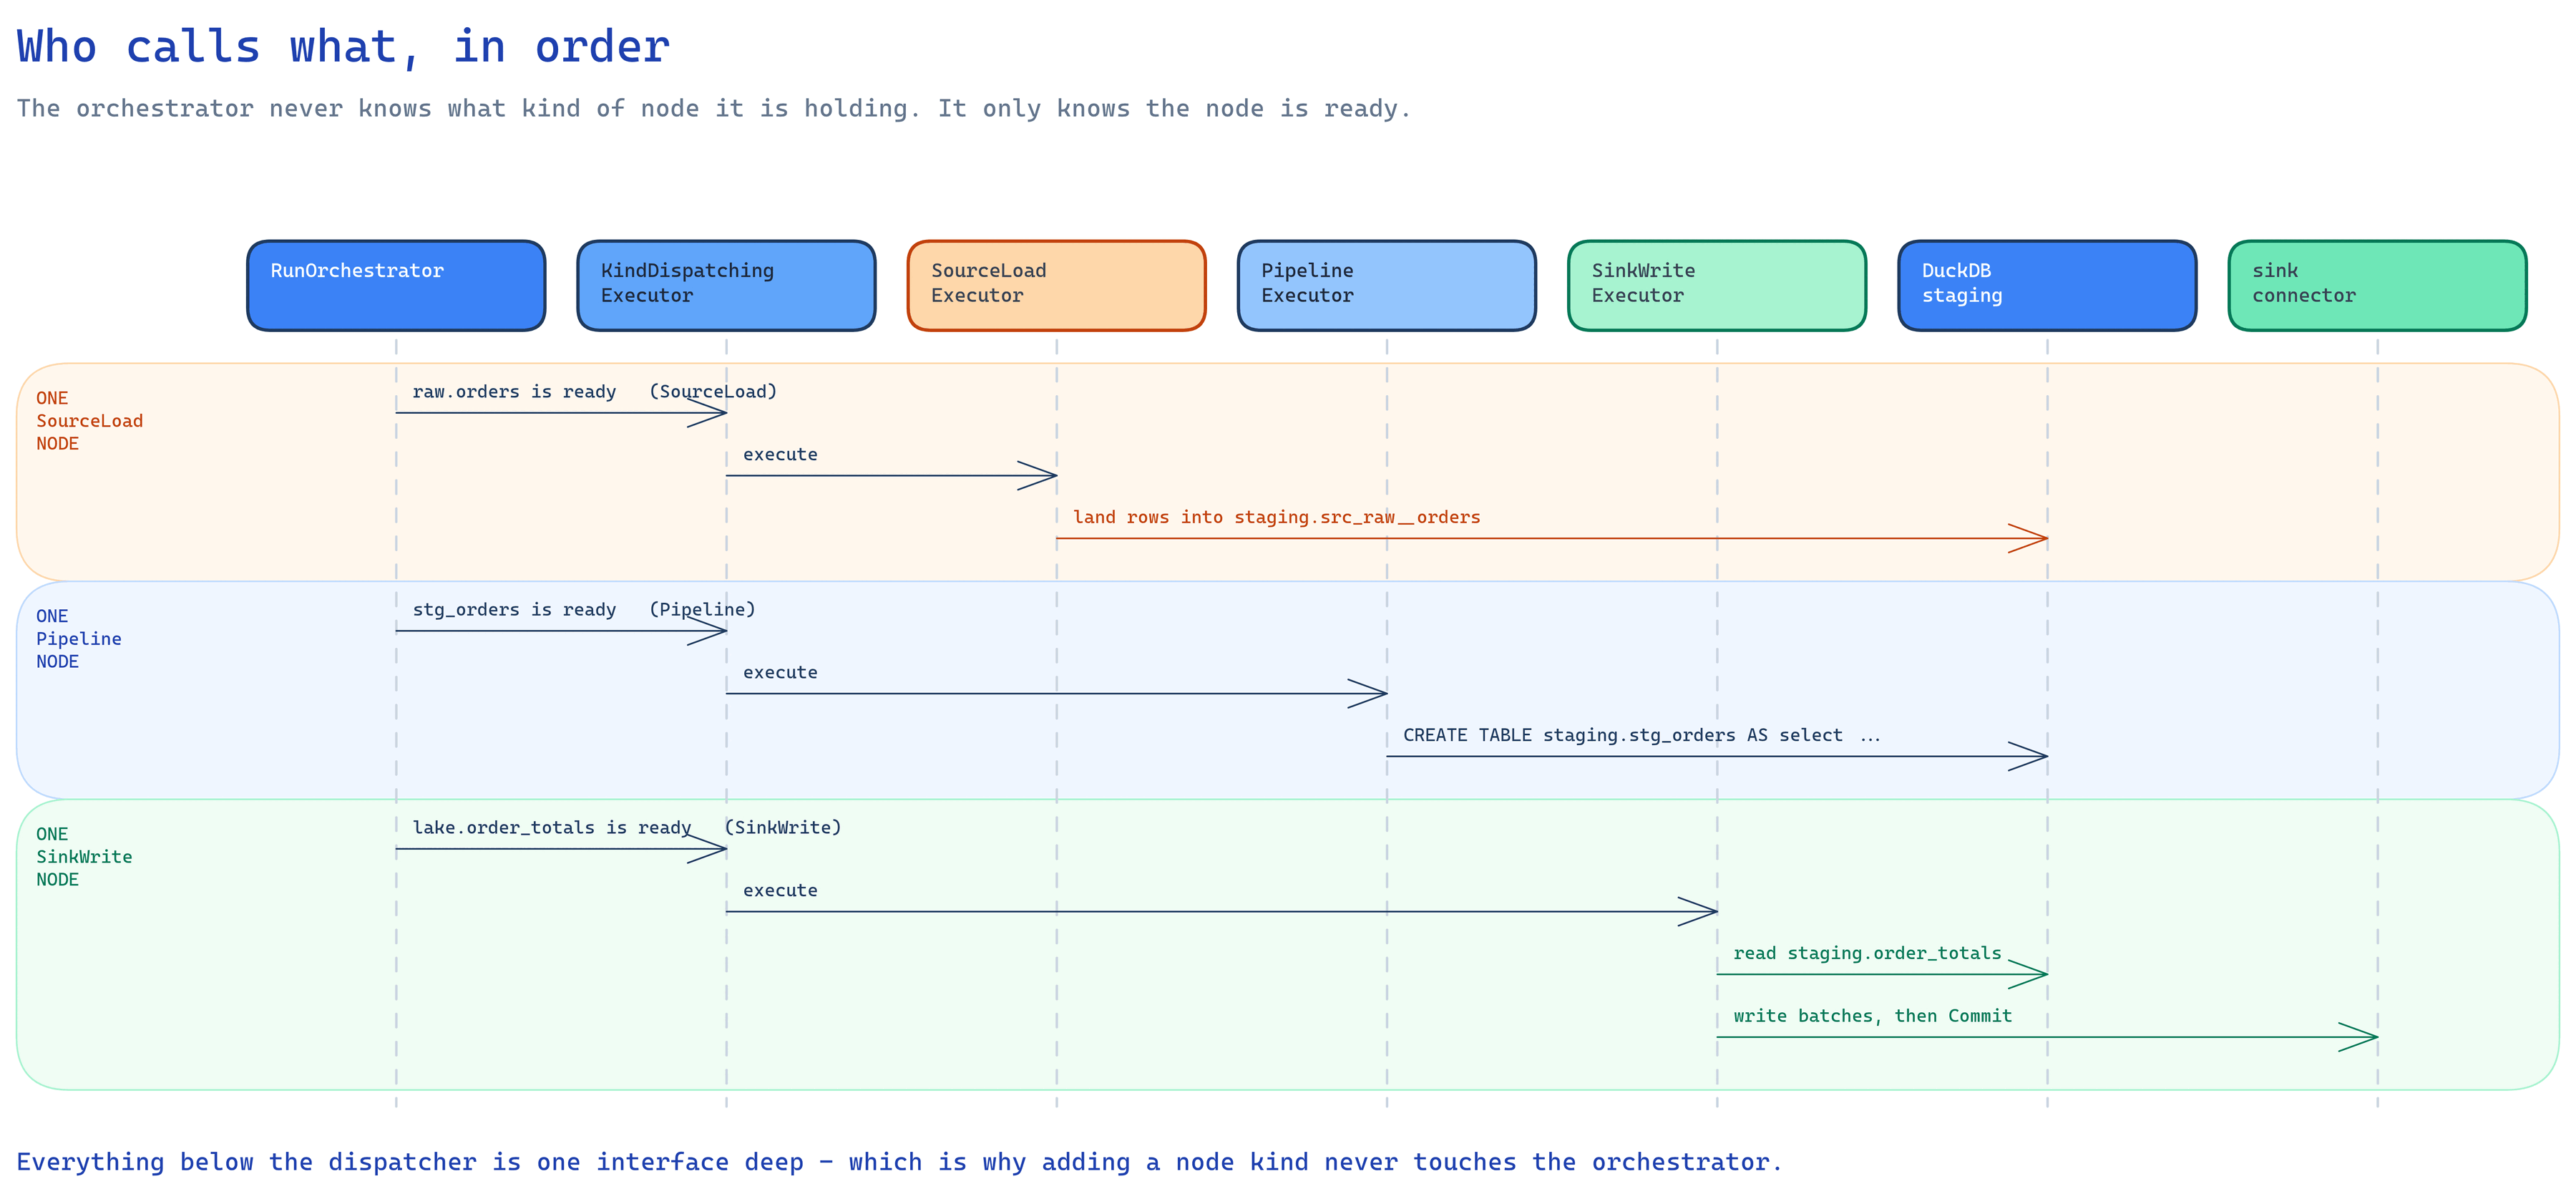
Each dispatched node goes to KindDispatchingExecutor, which is nothing more than a
switch on the node kind that hands off to the right executor — plus the shared wrapping
every node gets: engine-level retries for transient connector errors, and error
wrapping so an executor exception becomes a Failed result instead of killing the run.
What each executor actually does
Section titled “What each executor actually does”SourceLoadExecutor (src/Pz.Engine/Execution/SourceLoadExecutor.cs) — asks the
registry for the source connector, opens it, and lands the dataset into its staging table.
On the native_scan plan it just runs the connector-provided SQL fragment inside DuckDB; on
the universal plan it runs two overlapped tasks — the connector extracting Arrow batches
and DuckDB ingesting them — connected by a bounded channel (a fixed-size conveyor belt: if
DuckDB falls behind, the belt fills up and extraction naturally pauses; that’s backpressure).
For an incremental source, the connector also ANDs cursor > <last watermark> into its
extraction query (§8).
PipelineExecutor (Execution/PipelineExecutor.cs) — the simplest one: execute the
rendered SQL inside DuckDB as CREATE TABLE staging.<name> AS <select…> (or a view,
depending on materialization:). A pipeline marked ephemeral never gets its own node at
all — the compiler inlines its SQL into each consumer as a CTE.
CheckExecutor (Checks/CheckExecutor.cs) — turns each checks: entry into an
assertion query against the pipeline’s staging table (e.g. unique: [id] → “count rows where
id appears more than once”). In the example project the two entries in
orders_enriched.yml become two nodes named check_orders_enriched_not_null_id_email and
check_orders_enriched_unique_id, each depending on the orders_enriched pipeline node. Any
offending rows → the check node fails, the run reports failure (exit code 1), and up to five
offending values are recorded in run_results.json to help you find the bad data. Note the
graph shape in §5: a check hangs off its pipeline as a sibling of the sink write — it is an
alarm, not a gate, so the sink write (which depends only on the pipeline) still runs.
pz test is simply a run whose selection is “all Check nodes plus their ancestors”.
SinkWriteExecutor (Execution/SinkWriteExecutor.cs) — drains a staging relation out
through the sink connector. The universal path is a session with a strict lifecycle:
BeginWriteAsync → many WriteBatchAsync → exactly one of CommitAsync or
AbortAsync, never both. Commit-or-abort is what makes replace/merge outputs land
all-or-nothing (see Delivery guarantees). On the native_copy plan
it instead issues one DuckDB COPY statement that writes the file directly.
7. Arrow in one paragraph
Section titled “7. Arrow in one paragraph”Everywhere data crosses between a connector and the engine it travels as an Apache Arrow
RecordBatch: a few thousand rows in a columnar memory layout that DuckDB, .NET, and every
serious data tool agree on. Because everyone agrees on the byte layout, handing a batch from
a connector to DuckDB is zero-copy — a pointer changes hands; the values are never
re-marshaled one by one. The price of that speed is strict ownership rules (who is allowed to
free the buffer, and when) — the ABI defines them, and Pz.Connectors.TestKit exists largely
to catch connectors that break them, because use-after-free bugs in pooled native memory are
the worst bugs in this codebase.
8. Watermarks: incremental loads in plain terms
Section titled “8. Watermarks: incremental loads in plain terms”A watermark is a bookmark: “for raw.orders, I have already loaded everything up to
updated_at = 2026-07-15 23:10:04”. They live in .pz/state/watermarks.json, managed by
WatermarkStore (src/Pz.Engine/State/) and repaired by pz state.
The lifecycle, in order:
- Read: an incremental source’s extraction adds
where cursor > <bookmark>— only new rows are pulled. - Compute: after landing, the engine computes
MAX(cursor)over what actually arrived in staging — the candidate new bookmark. - Advance — only when it’s safe:
WatermarkAdvancement.Advanceruns as the last action of the run and moves the bookmark only if every sink write downstream of that source committed. If a sink failed, the bookmark stays put, so the next run re-extracts the same rows rather than silently losing them. Losing a little time is fine; losing rows is not.
9. What you see on screen (and in logs)
Section titled “9. What you see on screen (and in logs)”Executors never call Console.WriteLine. They report progress through one typed event
stream (IRunEvents → RunEventBus, contract in docs/events.md), and what
you see is a renderer subscribed to that stream:
- default:
LiveTreeRenderer, the live progress tree in your terminal; --log-format json:JsonRenderer, one NDJSON object per line, for machines and CI.
Same events, two views. The crash-safe run_results.json writer (§5, phase 7) is registered
directly on the event fan-out, not through the renderer machinery — a hung or broken
renderer can never corrupt the run record.
10. A reading path
Section titled “10. A reading path”If you want to internalize the codebase, read in this order — each file is self-contained enough to read top to bottom, and heavily commented with the why:
templates/sample/— the example project itself (you now know what each file means). Every template undertemplates/is a real, loadable pz project, embedded intoPz.Cliat build time.src/Pz.Cli/Commands/RunCommand.cs—ExecuteRunis the spine of this whole tour.src/Pz.Core/Dag/DagCompiler.cs— files → nodes → sorted DAG.src/Pz.Engine/Dispatch/RunOrchestrator.cs— the dispatcher from §6.src/Pz.Engine/Execution/SourceLoadExecutor.csandSinkWriteExecutor.cs— the data plane in practice.- Architecture overview — the decision log: why it’s built this way.
And keep docs/diagrams/ open — four presentation-grade diagrams of
exactly the mechanisms this page walked through.
Glossary
Section titled “Glossary”| Term | Plain meaning |
|---|---|
| DAG | Directed acyclic graph — boxes and arrows with no loops. Here: nodes are units of work, arrows mean “must finish first”. |
| Node | One dispatchable unit of work. Exactly four kinds: SourceLoad, Pipeline, Check, SinkWrite. |
| Connector | A plugin that knows how to talk to one kind of external system (files, Postgres, S3, …). Implements the interfaces in Pz.Connectors.Abstractions. |
| Source / dataset | A configured connection for reading (raw) / one table-like thing it exposes (orders). |
| Sink / output | A configured connection for writing (lake) / one destination it exposes (order_totals). |
| Staging | The run’s private DuckDB file where all intermediate tables live: .pz/runs/<id>/staging.duckdb. |
| Materialization | How a pipeline’s result is stored in staging: table, view, or ephemeral (inlined into consumers as a CTE). |
| Arrow RecordBatch | A chunk of rows in the columnar in-memory format all components exchange zero-copy. |
| Watermark | The saved bookmark of how far an incremental source has been loaded. |
| ABI | The versioned connector contract (interfaces + rules). Changes are additive-only so old connectors keep working. |
ALC (AssemblyLoadContext) |
.NET’s isolated plugin loader — one per connector package, so dependency versions can’t clash. |
| PZ#### code | Stable identifier on every user-facing error, e.g. PZ0214. Grep for it in the codebase to find exactly where it’s raised. |