03 — The data plane: two tiers, chosen per edge
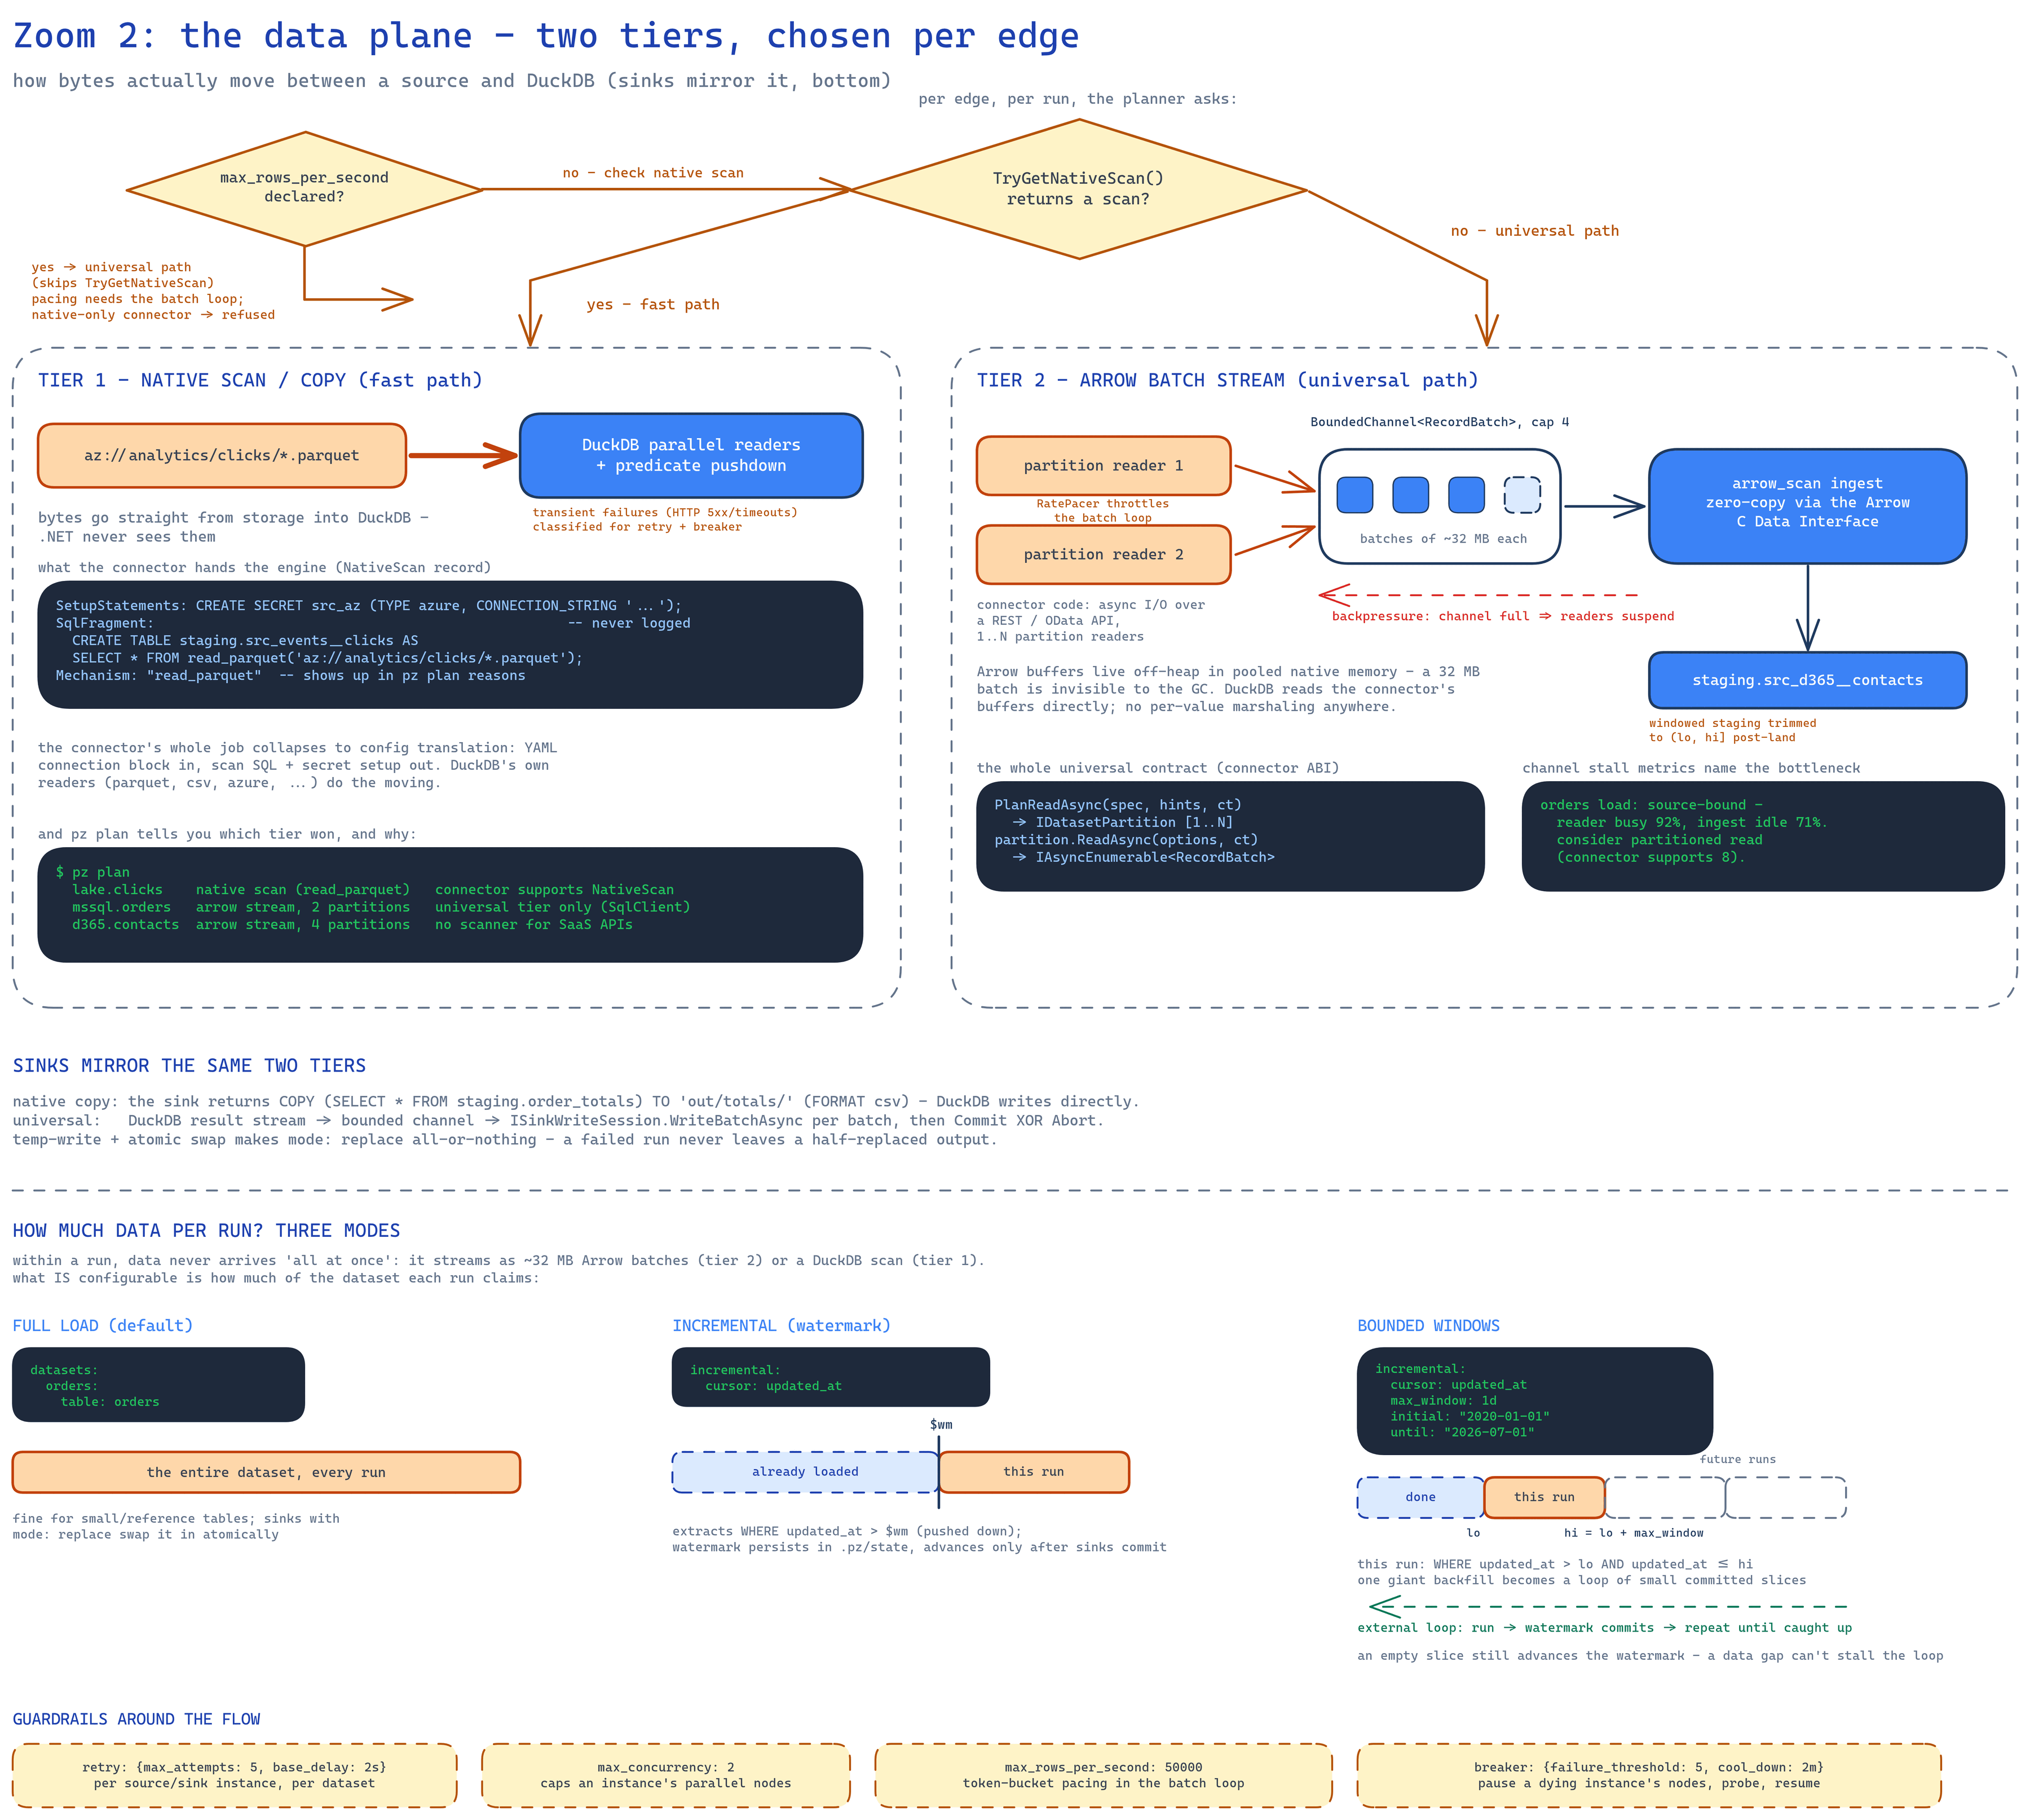
This diagram zooms into how bytes physically move. The DAG (diagram 02) is the control plane — it decides what runs when; the data plane is the part that moves the data itself.
A few terms:
- Planner — the compile-phase component that decides, for each edge, how its data will
move, and writes the decision plus the reason into
plan.json. - Edge — a point where data crosses between an external system and DuckDB: source → staging, or staging → sink.
- Native scan — DuckDB reads the external storage itself, with its own readers; the bytes never enter the .NET process at all.
- Apache Arrow — the industry-standard in-memory format for columnar data (values stored column-by-column rather than row-by-row — the layout analytical engines want). A RecordBatch is Arrow’s unit: a few thousand rows of a table, as a set of column buffers.
- Zero-copy — data is handed over by pointer, not re-serialized between formats; both sides read the same memory.
Why two tiers exist: DuckDB ships world-class readers — Parquet, CSV, Azure Blob (az://), and
via community extensions even SQL Server — with parallelism and predicate pushdown (the reader
applies your WHERE clause while reading, skipping data blocks that can’t match). Pumping those
bytes through .NET row-by-row would waste all of that. But not everything has a DuckDB reader:
SaaS APIs, message queues, proprietary systems. The diagram uses one example of each — Azure
Blob on the fast path, a Dynamics-style REST API on the universal path (OData is a common REST
convention for querying business data over HTTP).
Reading the diagram
Section titled “Reading the diagram”Top: the decision diamonds. For every edge the planner asks the connector: can you give me a
native scan? (TryGetNativeScan — a capability, meaning the connector implements an optional
interface and the planner discovers it; users don’t wire this up in config.) A smaller diamond
sits in front of that question: did the run set engine.force_universal? That setting is an
escape hatch that forces the universal path even when a native scan is available — useful for
debugging or working around a native-path bug. If the connector has no universal route for that
edge at all (INativeOnlySink, or a native-only source like azureblob), pz refuses the
combination outright with error PZ0312 instead of silently ignoring the setting.
Two smaller behaviors are tagged on the tier lanes. On the universal side, a windowed dataset
gets one extra DELETE trimming staging to the claimed window right after ingest — a backstop
for a connector that doesn’t honor the bound itself. On the native side, transient failures are
classified from a closed list of DuckDB httpfs error shapes (HTTP 5xx/408/429 and
connection/timeout phrases; httpfs is the DuckDB extension doing HTTP reads), feeding the same
retry and breaker machinery the universal path uses — a flaky database behaves identically no
matter which tier reached it.
Left panel: tier 1, native scan. The example is Azure Blob Storage via pz’s own builtin
azureblob connector — not a hypothetical. The fat arrow is the whole story: bytes go storage →
DuckDB; .NET never sees them. The connector returns SQL, not data: a CREATE SECRET statement
(DuckDB’s way of registering credentials — connection string, account key, service principal,
credential chain, or managed identity — never logged unredacted) plus a
read_parquet('az://...') scan fragment; sinks get the mirrored COPY (...) TO 'az://...'. The
connector’s whole job collapses to config translation: YAML in, SQL out.
The pz plan box shows that every tier decision is recorded with its reason. Note the middle
line: SQL Server is universal-tier only today — it streams Arrow batches over SqlClient (the
standard .NET driver). DuckDB’s community mssql extension is the designated future native
tier, but it isn’t wired up yet. No guessing about why a run was fast or slow.
Right panel: tier 2, the Arrow batch stream. The example is a SaaS API — the kind of system no engine will ever ship a scanner for. The connector plans 1..N partitions (independently readable slices of the dataset, so several readers can pull in parallel); each reader is plain async .NET code — paged REST calls, a queue drain, whatever — producing Arrow RecordBatches. Batches are byte-targeted at ~32 MB rather than row-counted, so wide and narrow tables both produce sensibly sized batches.
Between readers and ingest sits a bounded channel with capacity 4 — a fixed-size in-memory queue that makes producers wait when it’s full. That one primitive buys two things. First, backpressure for free: a fast producer is automatically slowed to the consumer’s speed, so memory use is capped at “capacity × batch size” instead of growing until the process dies. Second, diagnosability: the engine measures stall time on both sides of every channel, so it can state the bottleneck instead of making you infer it — “source-bound, reader busy 92%, ingest idle 71%, consider partitioned read” — naming a fix the connector actually supports.
Ingest is arrow_scan over Arrow’s C Data Interface — the in-process handoff convention where
two libraries (.NET and DuckDB) exchange column buffers as raw pointers. No per-value conversion
anywhere in the core path. Arrow buffers are also off-heap and pooled: the data lives in native
memory .NET’s garbage collector never scans, and buffers are reused batch after batch — a 32 MB
batch is invisible to the GC, so the managed heap stays tiny no matter how much data flows.
The ABI box makes the ecosystem point: the universal contract is small — plan partitions, stream
batches. An ADO.NET-backed connector (SqlClient included) is ~50 lines with the provided
DataReaderSource helper, which wraps any DbDataReader (.NET’s standard row-by-row database
reading API) and does the row→column pivot once, at the edge, into pooled native buffers.
Bottom band: how much data does one run claim? Within a run, data always streams — as ~32 MB batches or a DuckDB scan. The real question is how much of the dataset each run claims, and that’s configurable per dataset. The granularity ladder, smallest to largest: Arrow batch (~32 MB, the in-flight unit) → partition (parallel read within one load) → window slice (the commit/progress unit) → whole dataset. You tune the top of the ladder; the engine handles the bottom. Three modes:
- Full load (left) — the default: the whole table, every run. Fine for small and reference
tables (small, slowly changing lookup data);
write: { strategy: replace }sinks swap the result in atomically — readers see the old table or the new one, never a half-written mix. - Incremental (middle) — declare a cursor (a column that only moves forward, like a
modified-timestamp) and the extract becomes
WHERE updated_at > $wm, pushed down so the filter runs inside the source system and only new rows travel. The watermark ($wm) is the highest cursor value already safely delivered — the bookmark. It lives in.pz/stateand only advances after the sinks commit, so a failed run never loses or skips rows. - Bounded windows (right) — for the scary case: backfilling years of history from a flaky
source.
max_window: 1dcaps how far one run advances:WHERE cursor > lo AND cursor <= hi. One giant extraction becomes an external loop of small, watermark-committed slices — you simply runpz runrepeatedly (cron, CI, a shell loop) and each run bites off the next slice. A failed slice is retryable without re-extracting committed ones, and — the load-bearing detail — an empty slice still advances the watermark, so a gap in the data can’t stall the loop forever.
max_window takes any duration (30s, 15m, 1h, 1d) or an integer delta for numeric
cursors. Pick the slice that matches your blast-radius budget — the most work a single failure
can force you to redo. “Shrink the window” is the universal answer that works for every
connector; connectors that can name their exact position (a page token, a delivered-row count)
additionally declare checkpoint capabilities, and the engine resumes them mid-slice from ledgers
it keeps next to the staged data — see diagram 05.
The dashed yellow guardrails strip: per-instance protection lives in each external system’s own
YAML — retry policy per instance or dataset, max_concurrency capping an instance’s parallel
nodes, max_window bounding one run’s burst size, and a circuit breaker that pauses a dying
instance’s work, probes after cool-down, and resumes (an instance = one configured external
system, e.g. “this SQL Server”). The north star: a millions-of-rows backfill against a flaky
source and a flaky sink should be boringly survivable.
The strip under the tier boxes: sinks mirror the same design. Outbound has the same two
tiers: native COPY TO, or result stream → channel → write session. A write session is the
connector-side object that receives batches and then either commits or aborts — never
half-commits. Sessions are transactional in intent: write to a temporary location first, then
swap atomically on commit, so write: { strategy: replace } is all-or-nothing and a failed run
never leaves a half-replaced table.
Key points
Section titled “Key points”- Tier 1’s job is to make the connector disappear; tier 2’s job is to make anything connectable.
- Backpressure isn’t a feature that was built — it falls out of bounded channels.
- The engine doesn’t guess the bottleneck; it measures both sides of every channel and names it.
- Every tier decision is recorded in
plan.jsonwith a reason.
Common questions
Section titled “Common questions”- Why Arrow and not
IDataReader/DataTable? Columnar, zero-copy into DuckDB via the C Data Interface, off-heap (no GC pressure), and it’s the industry interchange format — ADBC, Arrow Flight, and Parquet all speak it, so choosing Arrow means speaking the same format as that whole ecosystem. Row-based edges are wrapped once, at the edge, into pooled buffers. - Which tier does SQL Server get? Universal-tier only today: it streams Arrow batches over
SqlClient, and
pz planstates that plainly. A native scan via DuckDB’s communitymssqlextension is the designated future native tier — additive viaTryGetNativeScan, alongside the existing universal path — but it isn’t wired up yet (the extension is experimental and needs network access at install time). Tier 2 is a different path, not a slow lane. - Which tier does Azure get? Native-only for reads: every azure read rides the native
scan/copy over DuckDB’s
azureextension — there is no universal fallback to demote onto, soengine.force_universalon an azure read dataset is refused at plan time (PZ0312) instead of silently routing to a stream that no longer exists. The universal tier survives on azure for writes only:partition_byfan-out (routing rows into per-day folders) isn’t expressible in one nativeCOPY, so it streams Arrow batches over the Azure Storage SDK. Blob (az:///azure://) and ADLS Gen2 (abfss://) both read through the native path;abfss://end-to-end coverage against Azurite (Microsoft’s local storage emulator) remains a documented test gap — the emulator’s hierarchical-namespace emulation isn’t faithful enough. - What about connectors in other languages, or crash isolation? The ABI is “async streams of Arrow batches + JSON config”, which maps 1:1 onto Arrow IPC (Arrow’s serialized wire format) over a child process’s stdio pipes. Out-of-process connectors are a future deployment option, not a redesign.
- Who decides partition count? The planner, from connector capabilities and hints; per-connector concurrency caps apply (a rate-limited API can say 1).
- Is a run one big transaction? No. Extraction streams in batches; each sink write session is transactional in intent (temp-write, commit-swap), and the watermark commits only after sinks do. With bounded windows, the unit of progress is one slice — small, committed, replayable. Merge sinks (upsert by key) make a replayed slice idempotent: applying it twice yields the same result, so retries can’t create duplicates.
- Can I get data in even smaller increments? Yes, at every level. Window slices go as small
as the duration grammar allows — a
15mwindow is a perfectly normal backfill slice. Within a slice, batch size is tunable (engine.batch_bytes, 1 MB–512 MB). Below that, mid-slice resume is capability-gated: a connector that can prove its position gets it — on the read side a partition checkpoint token (a page cursor the engine stores after each durably staged chunk), on the write side an acknowledged-row prefix (only rows the destination confirmed count) — both kept in engine-owned ledgers inside the run’s staging database, written transactionally with the data they account for. A connector that can’t prove its position (a plain SQL query has no restartable cursor mid-window) doesn’t pretend: for those, the answer stays “make the window smaller”. True streaming/CDC is out of scope today; CDC (change data capture — tailing a database’s change log continuously instead of running batches) is on the evolution path as a source capability emitting change batches over the same contract. - Is the backfill machinery shipped? Yes: watermark incrementals, per-instance retry config, bounded windows, concurrency caps, and the breaker are all merged.
Next: 04-run-lifecycle — what actually happens during pz run, and
what you see while it happens.