The execution model
This article explains what happens when a project runs: how the DAG is built and what its nodes are, the eight phases every command goes through, how work is dispatched, and how the engine reports what it’s doing.
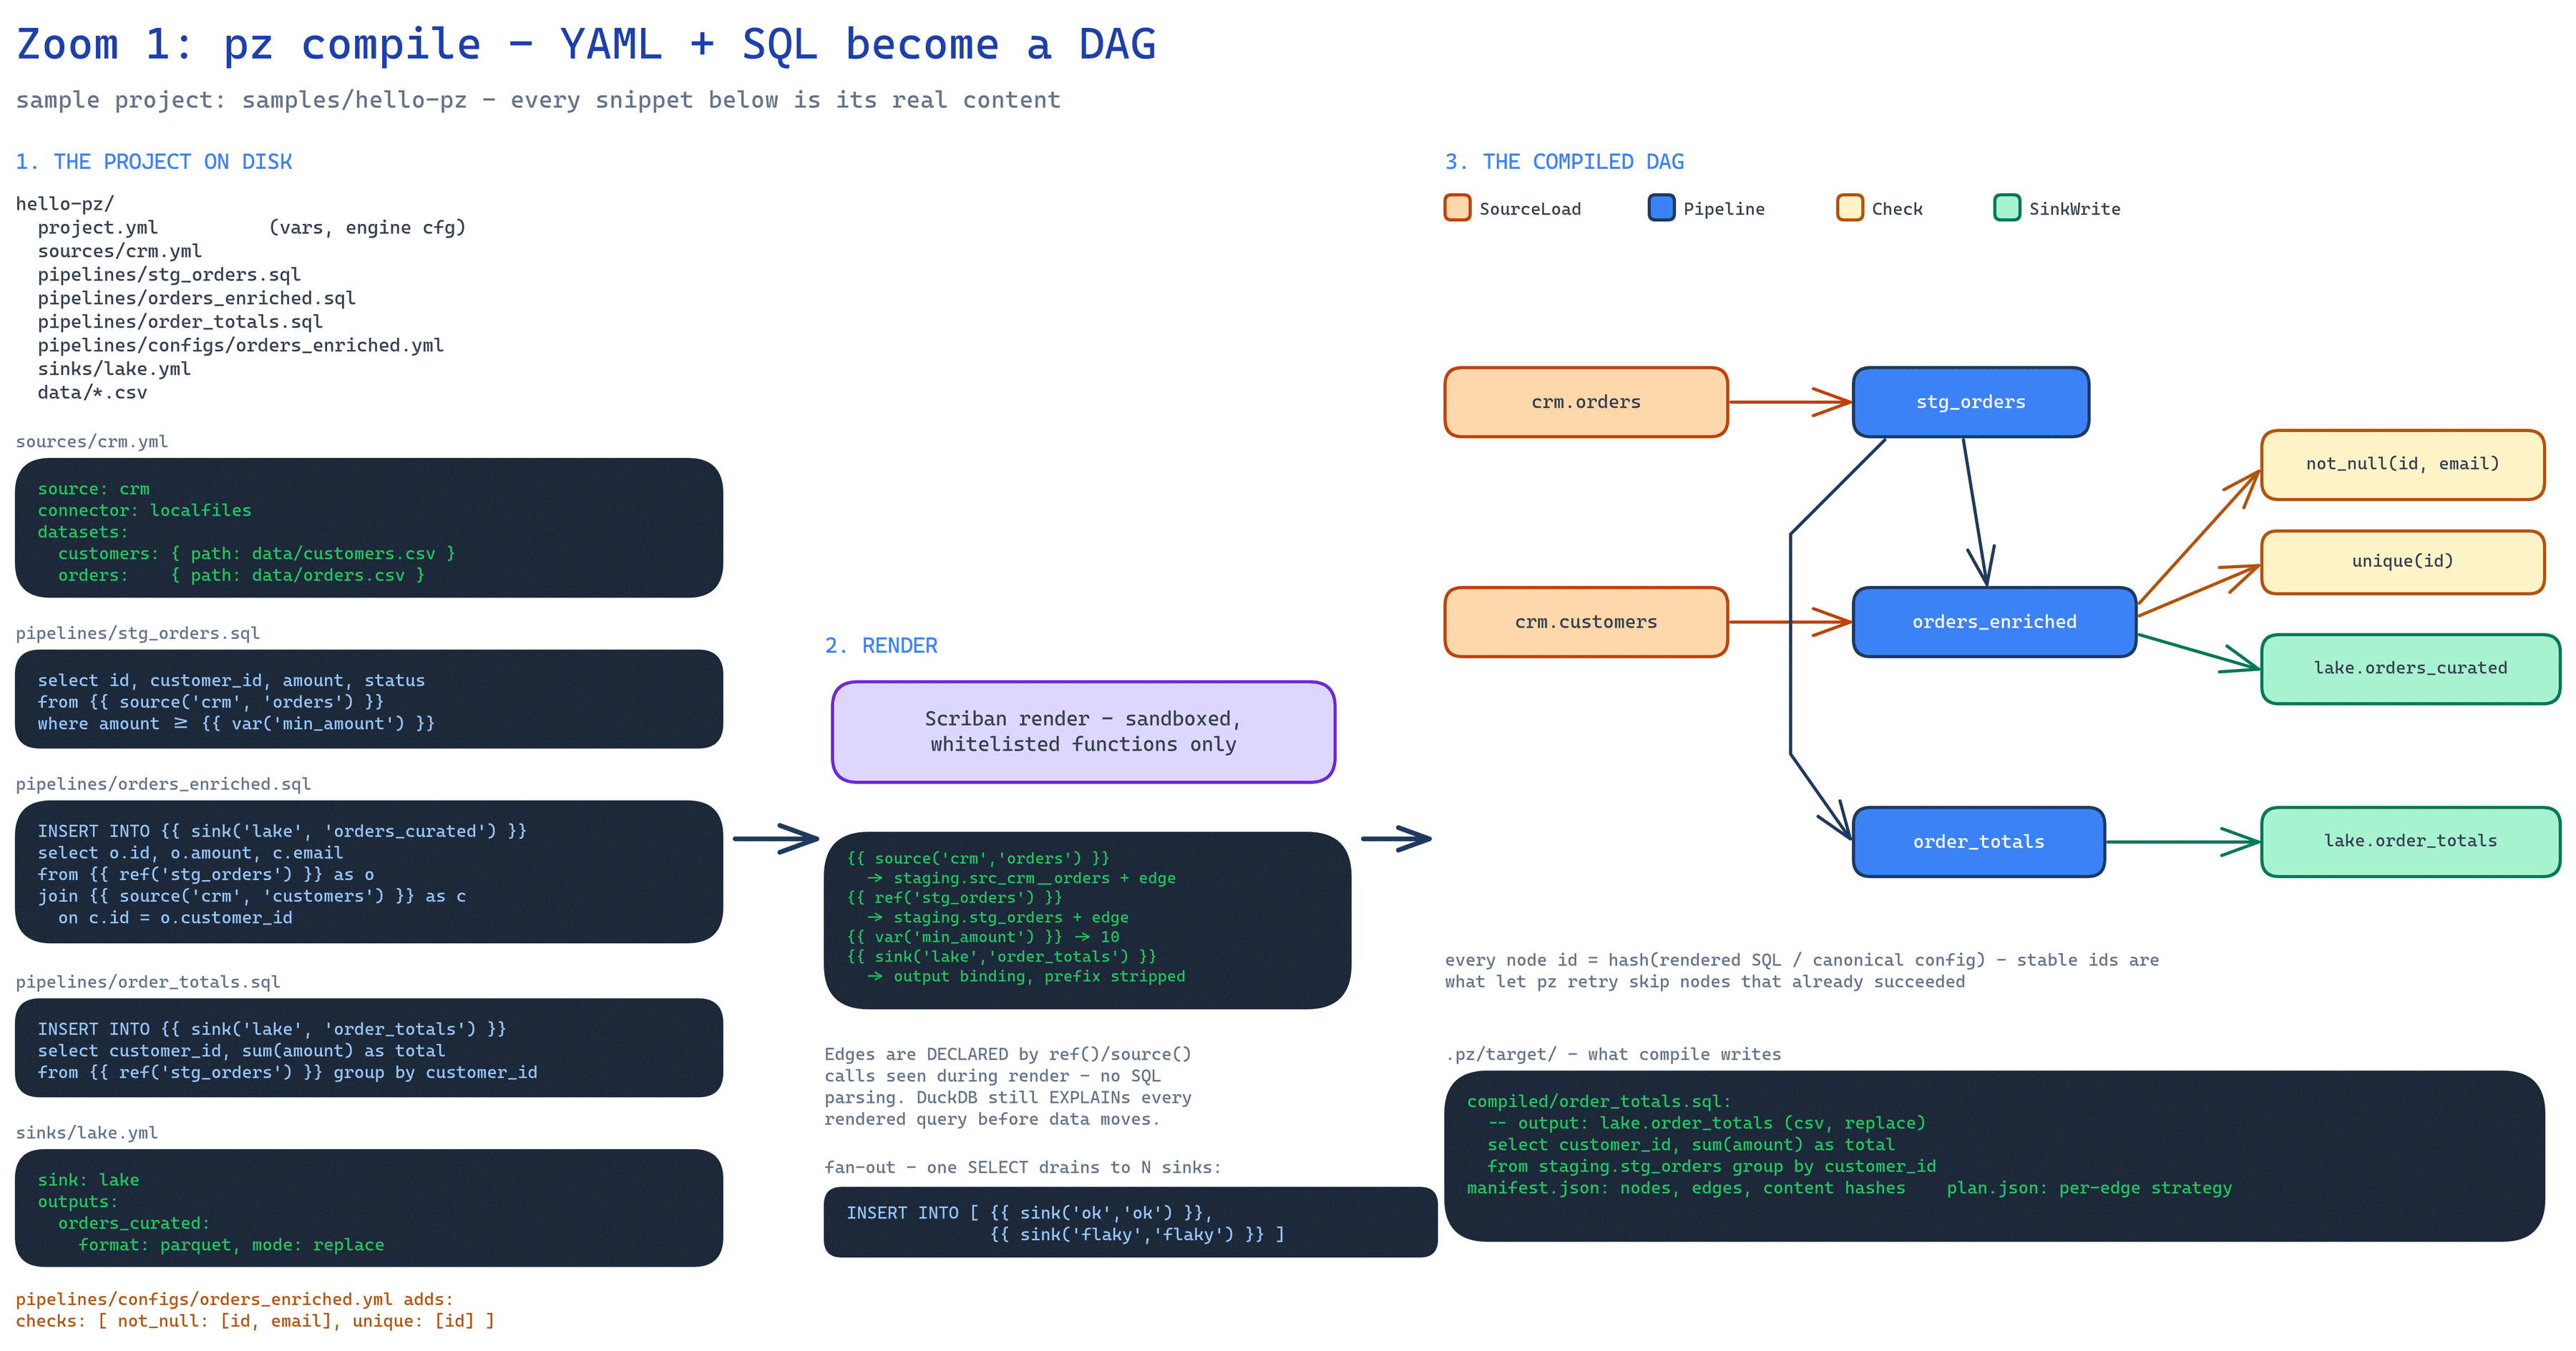
The DAG
Section titled “The DAG”Compilation produces a typed DAG with four node kinds:
| Node kind | One per | Does |
|---|---|---|
| SourceLoad | referenced source dataset (unreferenced datasets aren’t loaded) | Lands data into staging.src_<source>__<dataset> |
| Pipeline | .sql file |
Materializes staging.<pipeline> as table/view (ephemeral pipelines are inlined as CTEs into their consumers, dbt-style) |
| Check | data-quality check attached to a pipeline/source | Runs inside DuckDB — data is already there, so checks are nearly free |
| SinkWrite | sink output | Drains a staging table into the destination |
Each node gets a stable content-addressed ID — a hash of its rendered SQL or canonical
config. That’s what makes retries, caching, and incremental state coherent: pz retry can
trust that an unchanged hash means unchanged work.
One reader per source dataset
Section titled “One reader per source dataset”A source dataset is read by exactly one pipeline. Reading it from two is PZ0349.
To share extracted data, read it once and ref() that pipeline:
-- pipelines/stg_orders.sqlselect * from {{ source('erp', 'dbo.orders') }}Every other pipeline then writes ref('stg_orders'). That gives one extraction shared by every
consumer — the same shape pz produced implicitly before the rule existed, except the shared relation
is a file you wrote and can open. Shared narrowing goes in that file too, so the assumption is
written down rather than emerging from two others:
select * from {{ source('erp', 'dbo.orders') }}where region in ('US', 'EU')Referencing the same source twice within one pipeline — a self-join — is fine. The rule counts pipelines, not references.
The rule is what lets a pipeline’s SQL decide what pz extracts: with one reader there is no question of whose columns or whose filter to honour.
What the SQL pushes to the source
Section titled “What the SQL pushes to the source”Because each source dataset has exactly one reader, pz reads that pipeline’s SQL and asks the
connector for the columns it names and the filters it applies, instead of extracting the whole table
and discarding most of it in DuckDB. A connector that supports it (postgres, sqlserver) issues a
narrower query; one that doesn’t is handed nothing and extracts as before. Results are identical
either way — the pipeline’s own SQL still runs in DuckDB over whatever landed — so pushdown changes
how much data moves, never which rows you get.
pz plan says which happened per source, as counts:
arrow_stream src_erp__orders arrow stream: connector 'postgres' has no native path [pushed: 3 columns + filter]Two things are deliberately never pushed. A select * (or t.* over the source) suppresses column
pruning entirely — a star means every column is referenced, and pruning a referenced column would
leave the staged table missing it. And the cursor column of an incremental dataset is never pruned
away even when the SQL doesn’t select it, because watermark advancement reads MAX(cursor) back off
the staged table.
Filters ride a different channel from watermark bounds, and the asymmetry is intentional:
| carries | incapable connector | unrecognised SQL shape | |
|---|---|---|---|
columns and ordinary WHERE filters |
an optimisation | push nothing | push nothing |
cursor bounds (initial, max_window, until) |
correctness | refuse (PZ0313) |
refuse (PZ0224) |
A dropped optimisation costs time. A dropped bound would silently change which rows you extracted, so pz refuses instead of degrading.
A pipeline’s INSERT INTO {{ sink(...) }} may name one output (scalar) or several (array
form, for fan-out) — either way it’s still one Pipeline node. The SELECT materializes
staging.<pipeline> exactly once; each listed output gets its own SinkWrite node draining
that same staging table. Materialize-then-drain covers fan-out for free: one materialization,
N independent drains, no extra query cost per output.
Independent flows
Section titled “Independent flows”A project’s DAG is often not one connected graph but several. An independent flow is a
connected component of the DAG — a set of nodes wired together by ref()/source()/sink()
edges, with no edge crossing to any other component. A typical project is a handful of
source → pipeline → sink chains that never touch, so each chain is its own flow.
pz run <name> runs exactly one flow: it resolves name to a node and executes that node
plus everything upstream and downstream of it (equivalent to --select +name+), so
naming the transform still drives its sinks. Multiple names union their flows; pz run --all
runs the whole project. Because running everything should be a deliberate choice once a
project holds more than one flow, bare pz run is a PZ0215 error when the DAG has two or
more components — you name a flow, pass --all, or use --select. (pz plan accepts the
same selection but never gates: with no selector it prints the full project.)
Flows are derived structurally, so they follow the edges rather than any naming convention.
Two chains that look separate but share a ref()’d pipeline compile to a single node feeding
both, which connects the components into one flow — so bare pz run on that project runs everything
without tripping the PZ0215 gate. Naming a node still runs only its own closure: pz run pipe_a
pulls in the shared upstream pipeline (an ancestor) and pipe_a’s own descendants, but not the
sibling chain, since a sibling is neither an ancestor nor a descendant. That is the intended reading
of “connected = one flow”; if you want two chains that are independent for the gate as well, give
each its own upstream.
Two chains cannot share a source() dataset instead — that is PZ0349 (see
One reader per source dataset above). A shared staging pipeline is
how sources reach several chains, and it connects them into one flow exactly as a shared source node
used to.
The eight phases
Section titled “The eight phases”Every command runs the same eight phases; pz compile and pz plan simply stop early.
load ▶ restore-check ▶ compile ▶ validate ▶ plan ▶ execute ▶ finalize ▶ report- Load — parse project files; interpolate env; apply
--varsoverrides. - Restore-check — lock file consistency, connector protocol handshake (manifests only).
- Compile — render templates with injected constants (
run_id, a singlerun_started_at), extract DAG edges, write rendered SQL to.pz/target/compiled/andmanifest.json— the machine-readable project description (nodes, edges, hashes, configs), dbt-artifact-compatible in spirit for tooling to build on. - Validate — tiers 1–4; see Validation and errors.
- Plan — choose the data-plane tier per edge (native vs. arrow-stream), partition counts,
batch sizes, node order; write
plan.json.pz planpretty-prints it, including why fast paths were or weren’t chosen. - Execute — the dispatcher runs the DAG with per-node retries, checkpointing every node
completion into
run_results.jsonincrementally (crash-safe). - Finalize — sinks committed or aborted; the staging DB is retained after every run,
success or failure — the same retained staging DB a later
pz retryreads its reusableSourceLoadtables from. Automatic retention (retention:inproject.yml, on by default atkeep_last: 10) then deletesstaging.duckdbfrom runs past that window, staging-only —run_results.jsonis always kept, so run history andpz retrystay intact. Setretention: offto disable it.pz cleanremains the on-demand verb, and the only way to purge whole run directories or select by age. - Report — human summary + machine artifacts; the exit code reflects the outcome (0 ok, 1 completed-with-node-failures, 2 config/validation error, 3 fatal).
pz retry re-runs from run_results.json: a node is skipped when it succeeded and its
content hash and upstream results are unchanged. For each failed/skipped SourceLoad it
retries, it first tries reusing the failed run’s staged table — copied from that run’s
staging DB in-DuckDB, guarded by a row-count check, and never contacting the connector —
falling back to normal extraction (with a note:) if the guard fails or --full-refresh was
passed. Sinks that already committed in the failed run are carried forward into the retry’s
own results when every source they depend on was reused byte-identically, which is what lets
a fully successful retry advance the watermark. See
Delivery guarantees for the eligibility rules, the fallback
behavior, and what the resulting provenance field means.
Inside a node
Section titled “Inside a node”Within a SourceLoad on the universal path, three stages run concurrently, connected by bounded channels:
[connector reader(s)] ──▶ BoundedChannel<RecordBatch> ──▶ [DuckDB arrow_scan ingest] (async I/O, possibly capacity: 4 (native threads) N parallel partitions)- If the connector supports partitioned reads (
PlanReadAsyncreturns more than one partition), N readers feed the channel concurrently. - Bounded channels give backpressure for free: a slow ingest suspends readers; a slow source leaves DuckDB idle to serve other nodes.
- The engine measures time spent awaiting on each side of every channel — that’s how the bottleneck diagnostics below can state which side is the constraint.
SinkWrites mirror this: DuckDB result stream → channel → one or more writer sessions.
Dispatch and concurrency
Section titled “Dispatch and concurrency”Dispatch is a straightforward topological dispatcher with a global concurrency limit
(engine.threads, dbt-familiar). Nodes become runnable when all parents succeed; I/O-heavy
nodes (loads/writes) and CPU-heavy nodes (transforms) overlap naturally, because DuckDB
queries run on DuckDB’s own thread pool while .NET async handles the edges.
Three concurrency domains, each with one owner:
- DAG level — the dispatcher:
engine.threadsconcurrent nodes, plus per-connector caps (a Postgres source may allow 8 parallel reads; a rate-limited SaaS API may allow 1). Per-instance caps (v0.3): a source/sink instance’s ownmax_concurrency:additionally bounds how many of that one instance’s nodes run at once, enforced by a semaphore acquired before the dispatcher’s globalengine.threadspermit — instance-before-global, so a capped instance’s nodes queue against their own limit without narrowingengine.threadsfor everyone else. Absent, an instance is bounded only byengine.threads.max_concurrencybounds concurrent nodes, not connections:partitions: Nstill governs intra-node connection fan-out within one SourceLoad, so the worst case per instance ismax_concurrency × partitionsconnections. - Node level — async pipelines over
System.Threading.Channelsbounded channels (default capacity 4 batches); optional N partition readers/writers per node. Everything is async/await; no dedicated threads on the .NET side. - Query level — DuckDB’s own morsel-driven parallelism (
duckdb.threads). The engine treats DuckDB queries as opaque async operations and never micro-manages them.
DuckDB gets one process-wide database with one serialized connection per run, gated by a
SemaphoreSlim to ensure safe statement execution — a single DuckDBConnection is not safe for
concurrent statement execution, and unguarded dispatch raced on DuckDB’s native pending-query
state. Concurrent pipeline queries are dispatched by the topological dispatcher, not run over
parallel connections. This is a
correctness constraint, not a performance problem: the measured concurrent/sequential ratio is
0.94–1.04 (see Performance) — the gate serializes real DuckDB work with
minimal overhead. As-built limitation: connection-per-operation is a later
spike.
Cancellation is a single CancellationToken tree: Ctrl-C is graceful (stop dispatching, cancel
nodes, abort sink sessions, finalize artifacts); a second Ctrl-C forces. Connectors must honor
tokens, and the TestKit verifies they do.
Observability
Section titled “Observability”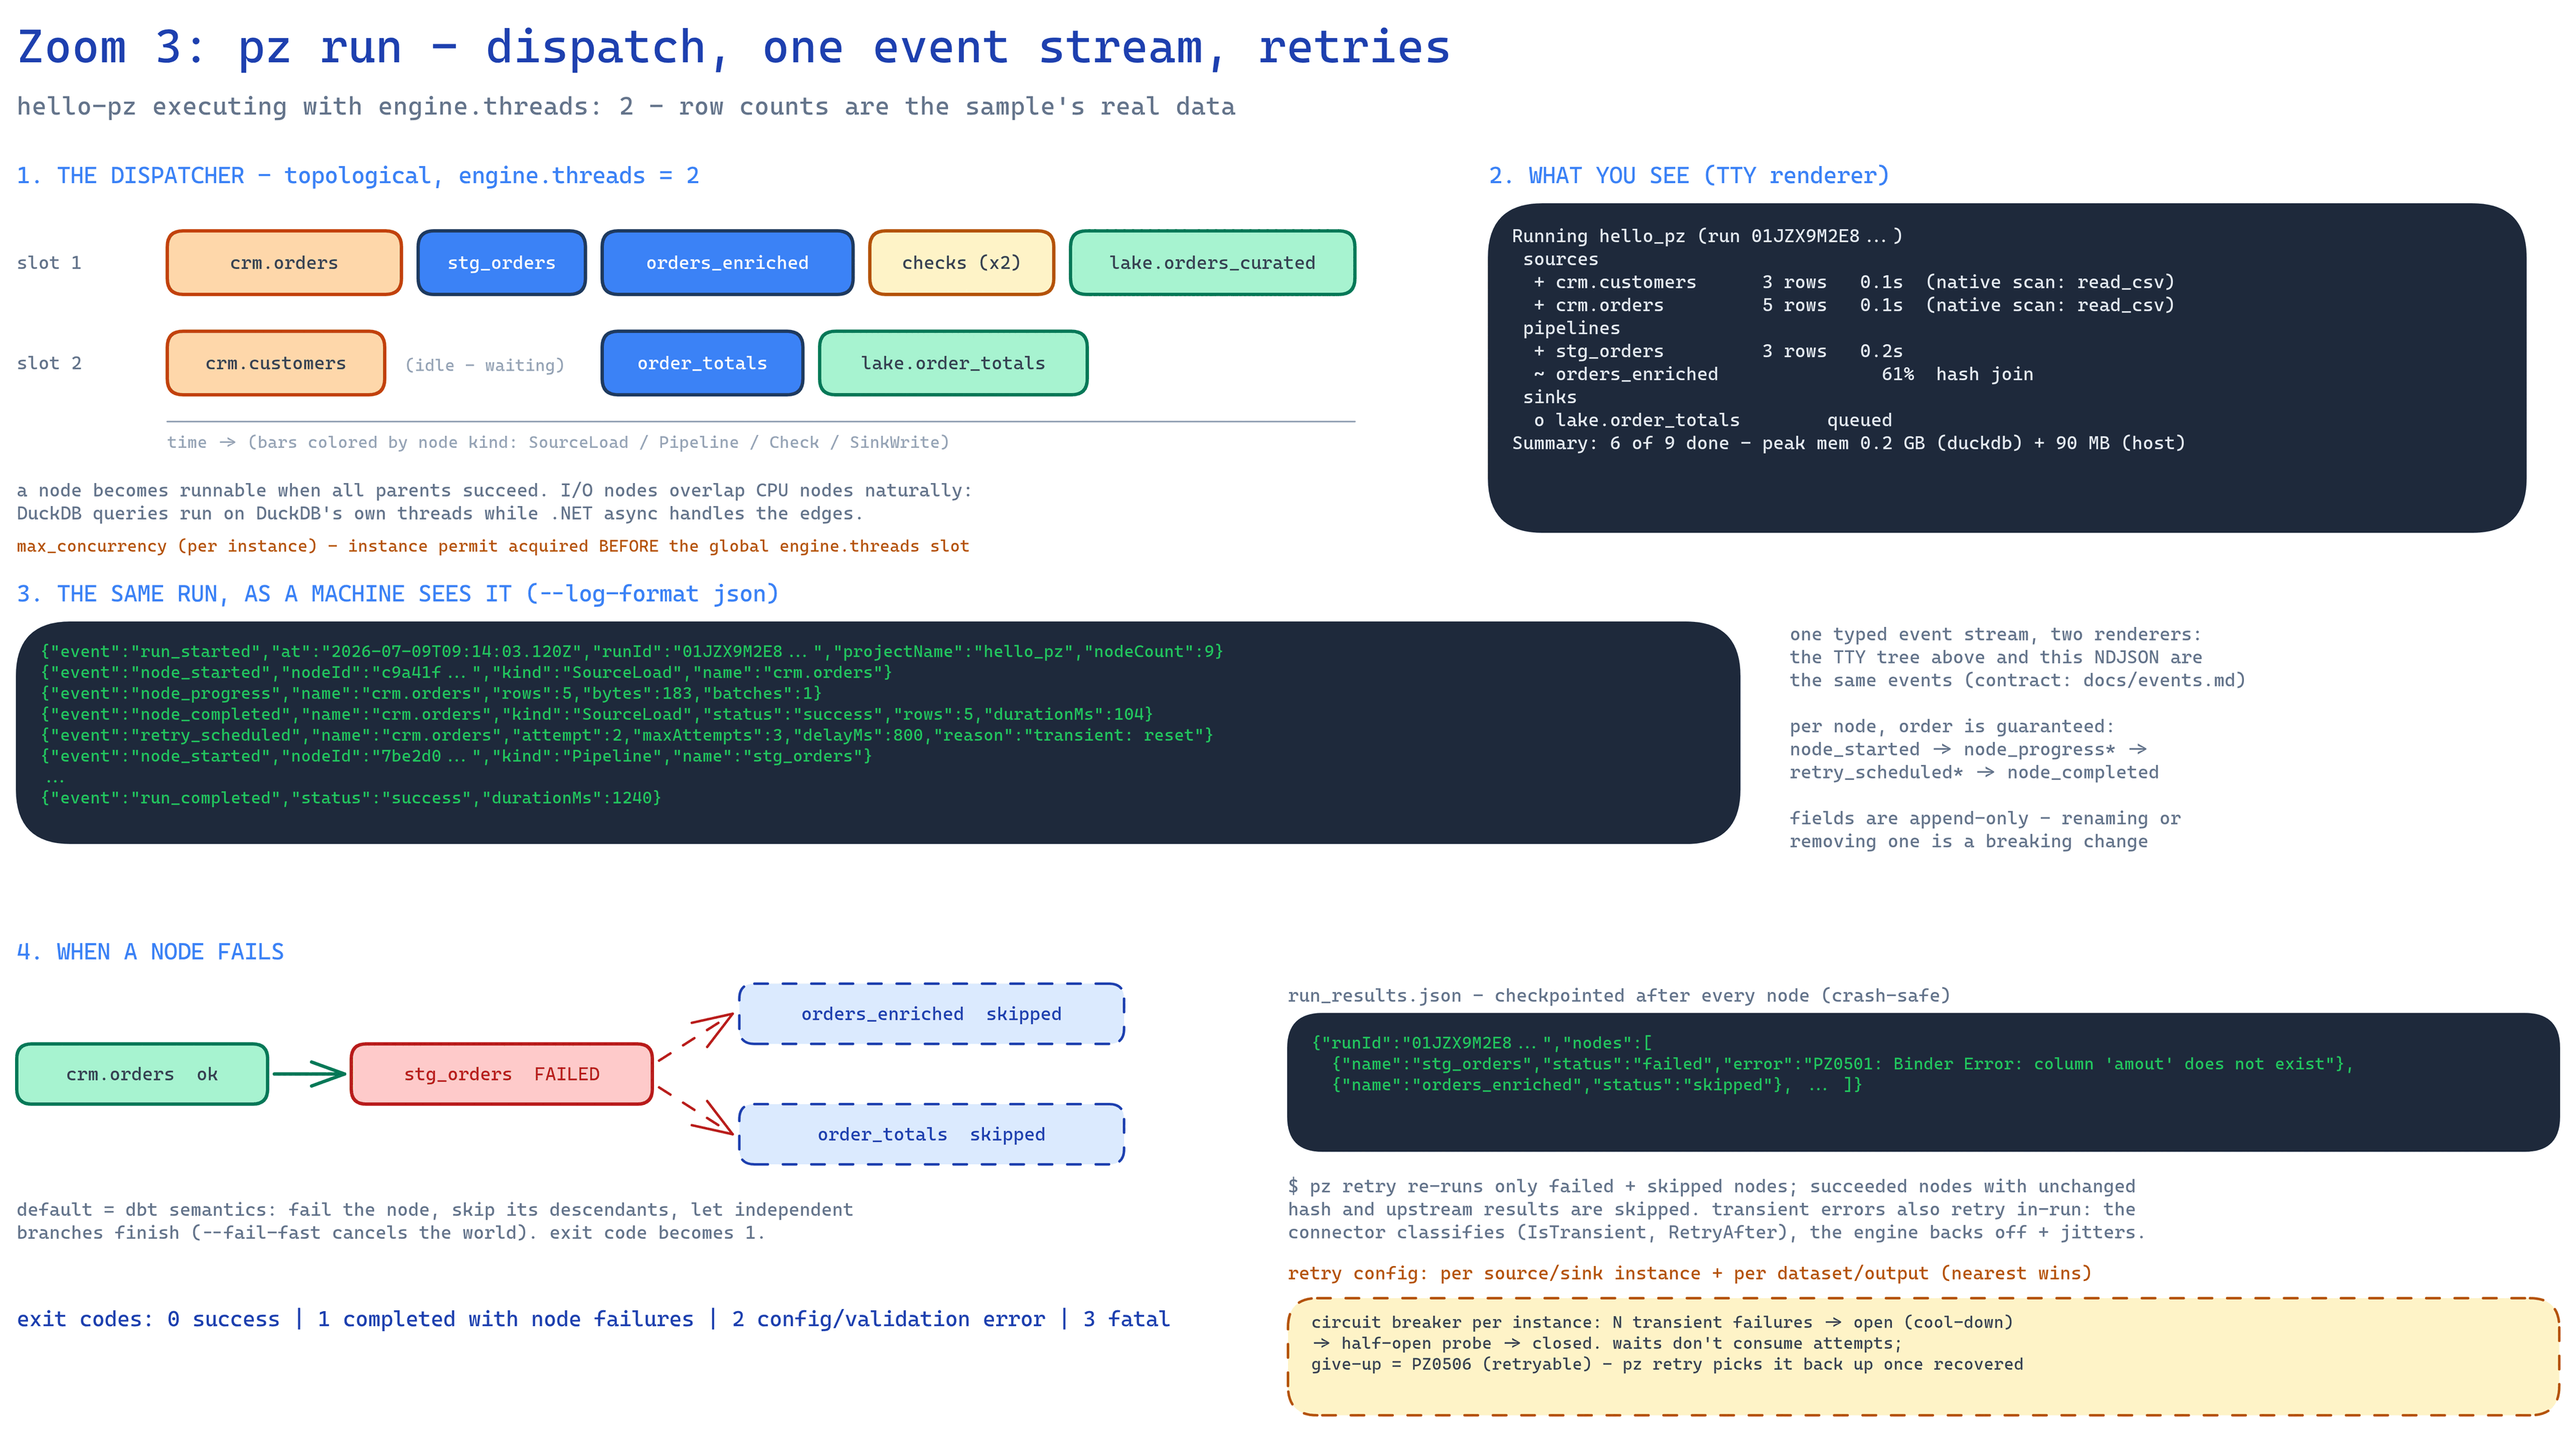
There is one structured event stream with multiple renderers — the console tree, NDJSON, and (later) OTel are all views over the same events.
- Events are strongly typed with stable IDs and schemas, documented as the normative
--log-format jsoncontract in Run events: run lifecycle events (RunStarted,RunCompleted), node events (NodeStarted,NodeProgress,NodeCompleted), and retry events (RetryScheduled). - Timings are decomposed per node — extract wait vs. ingest wait vs. query time vs. write
wait. Because every channel measures both producers’ and consumers’ stall time, the engine
can state the bottleneck rather than make you infer it:
orders load: source-bound — reader busy 92%, ingest idle 71%. Consider partitioned read (connector supports 8). - OpenTelemetry-ready from day one, exporter optional — all spans are
ActivitySource("Pz.Engine")activities (run → node → stage), all counters areSystem.Diagnostics.Metricsmeters (pz.rows_moved,pz.bytes_moved,pz.batches,pz.node.duration).--otel-endpoint(or env) wires the OTLP exporter; zero cost when off.pz.run.completedis a counter incremented once per run at completion, taggedpz.run.status(success/completed_with_failures/fatal) — the alertable terminal-outcome signal. - Run artifacts —
manifest.json,plan.json,run_results.json(per-node status, timings, row counts, errors): the integration surface for orchestrators, lineage tools, and CI assertions. - Connectors receive an
ILoggerscoped with connector/node identity; their logs interleave correctly in both renderers.
Next steps
Section titled “Next steps”- The data plane — what moves through those channels.
- Run events — the NDJSON contract, field by field.
- CLI reference — the verbs that drive these phases.