8. Monitoring and observability
A pipeline you can’t see is a pipeline you find out about from your users. Article 7 made the data tell the truth; this article makes the pipeline tell the truth: did it run, did it succeed, how long did it take, what exactly happened at 03:12 - and can you find out before the owner opens a stale dashboard?
Two words, one distinction worth keeping:
- Monitoring answers known questions automatically: is it up? did it fail? is it slow? Smoke detectors.
- Observability is the property that lets you answer questions you didn’t plan for: why is Tuesday’s revenue table missing the Berlin store? The investigation kit.
You need both, and they’re built from the same raw material.
The raw material: events, logs, metrics
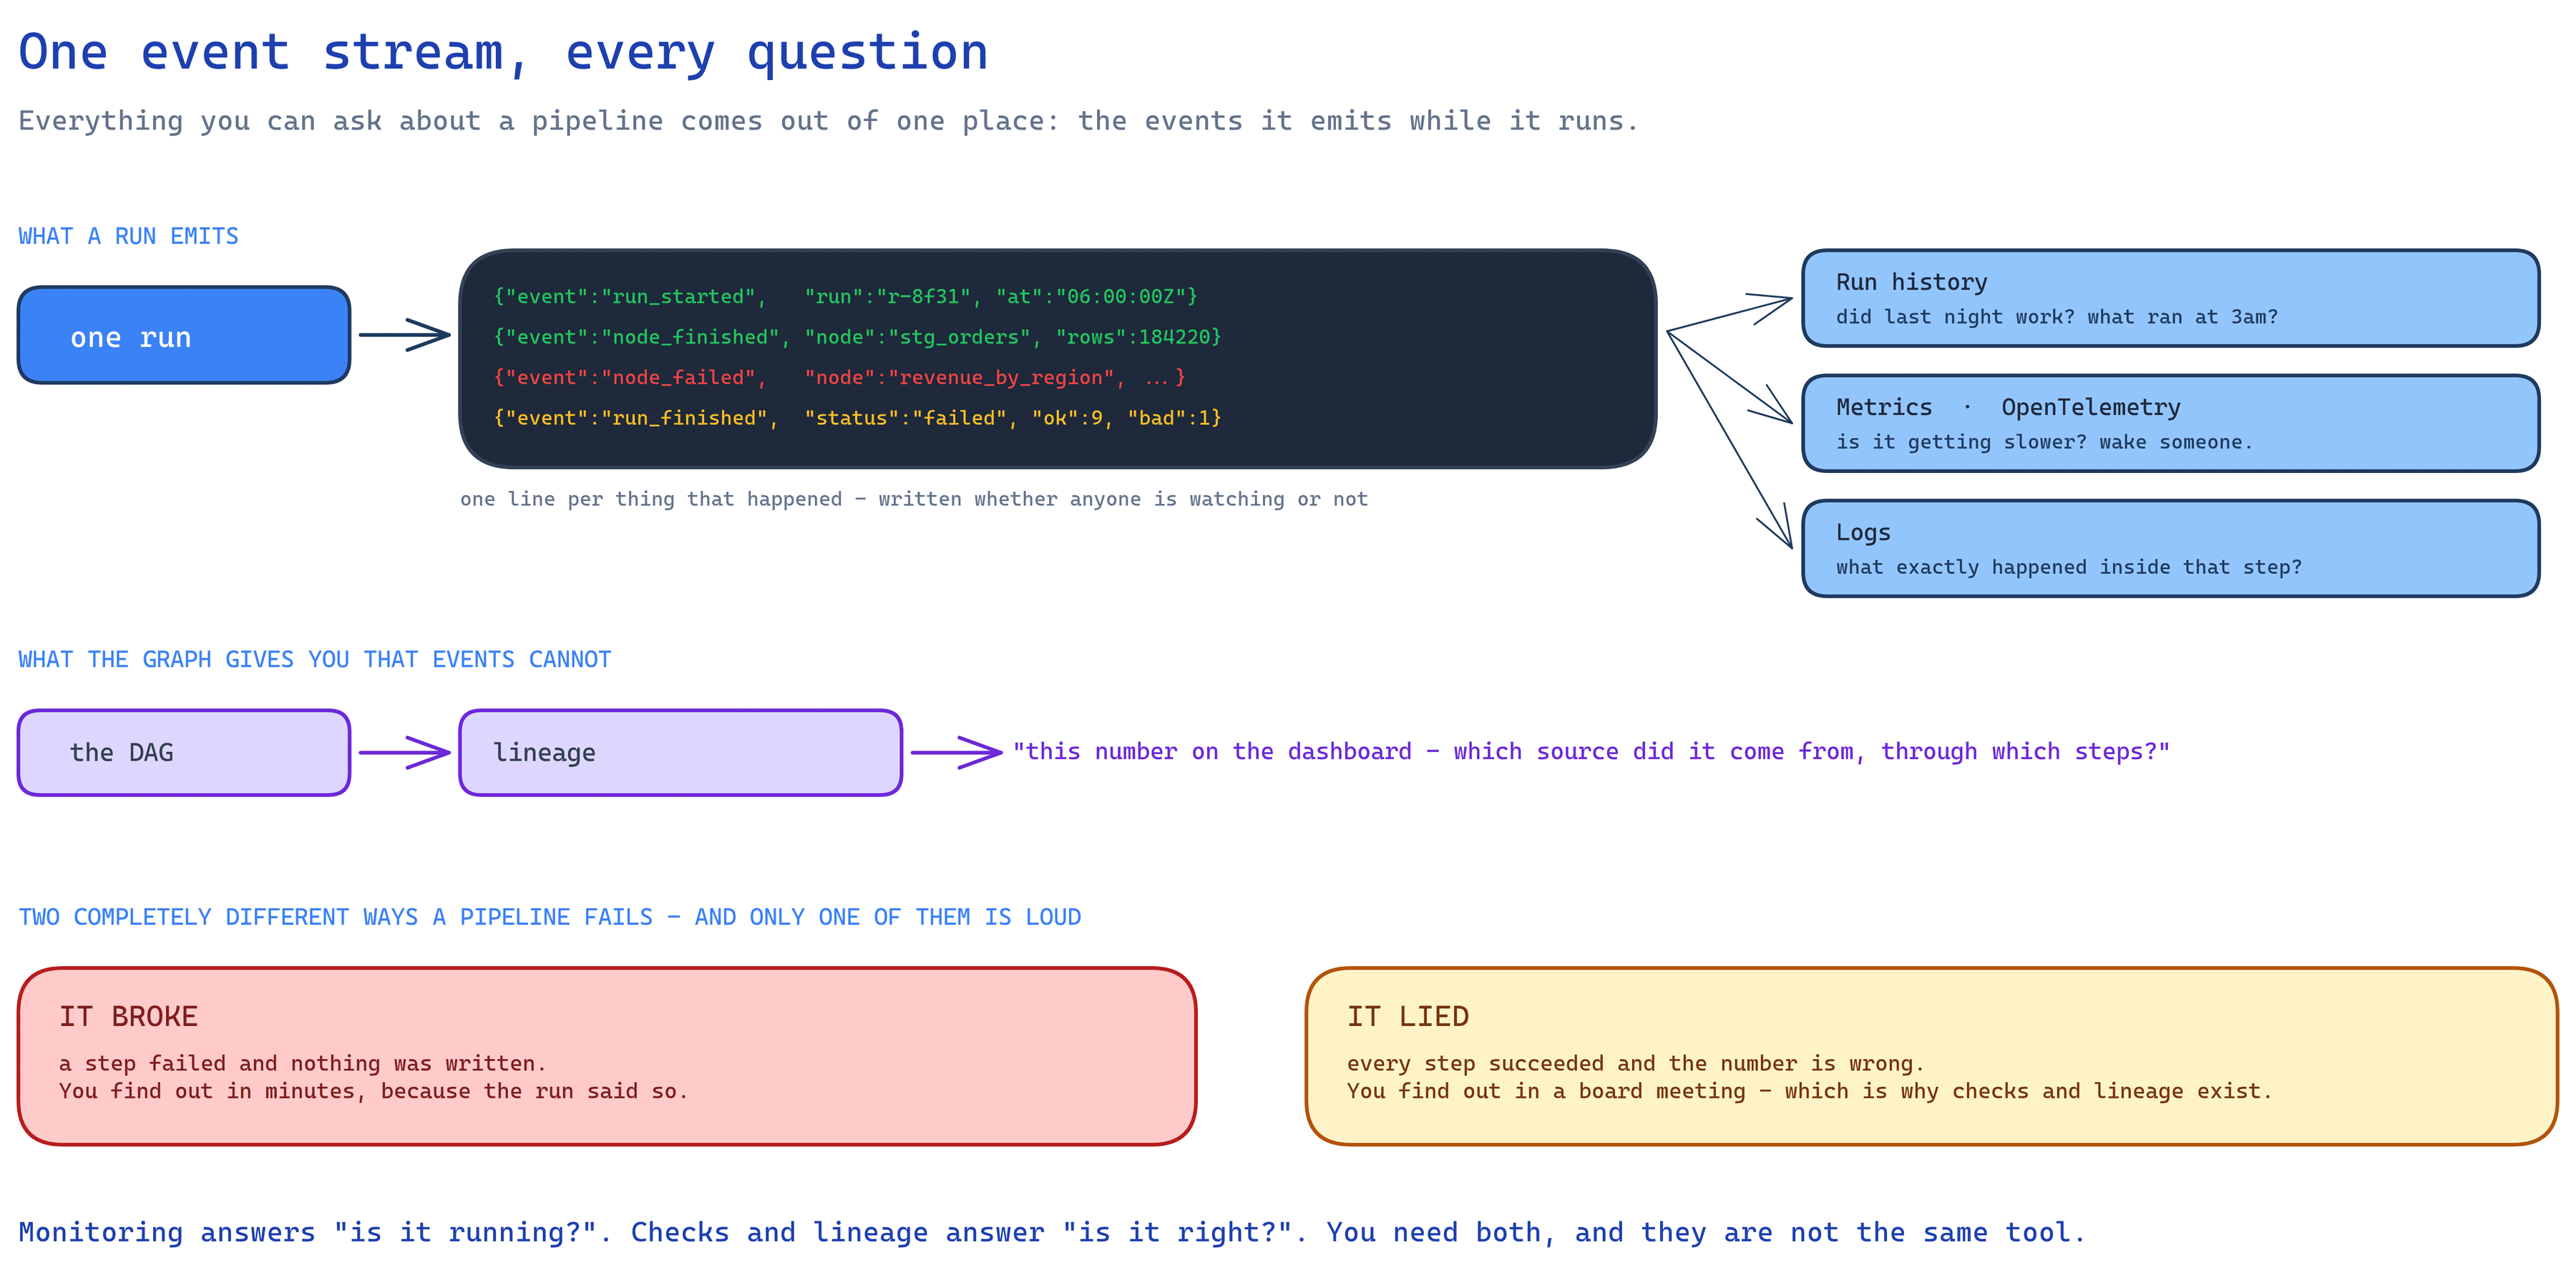
Section titled “The raw material: events, logs, metrics”Structured events are the foundation. The difference from prose logs is the difference between a diary and a ledger:
# prose - pleasant to read, awful to query06:01:32 Loading orders... done! 4,812 rows, took 41s
# structured (NDJSON: one JSON event per line) - a machine can aggregate months of this{"event":"node.completed","node":"src_shop__orders","status":"ok","rows":4812,"duration_ms":41210}
Emit structured events and every question becomes a query: average nightly duration, row counts by week, failure rate by source. Prose can’t do that, and 3 a.m. debugging shouldn’t depend on regexes over prose.
From events, three derived layers:
- Run history - a persisted record per run: what ran, node by node, with statuses, row counts, and timings. This is the pipeline’s memory; article 6’s resume-from-failure is literally a query against it.
- Metrics - numbers over time (runs succeeded, rows moved, duration). Feed them to whatever your ops world already watches; the emerging lingua franca is OpenTelemetry (OTel), a vendor-neutral standard that means your pipeline can report to Azure Monitor, Grafana, or Datadog without bespoke glue.
- Logs - the detailed prose, kept for the deep-dive after monitoring points at the right haystack.
The questions that matter
Section titled “The questions that matter”Dashboards full of unread charts are decoration. Monitoring earns its keep by answering four questions, in order of importance:
- Did it run at all? The sneakiest failure is the run that never started - the server rebooted, the scheduler entry was lost. Nothing errored, so nothing alerted. The fix is a heartbeat: an expectation that fires when the nightly run doesn’t check in by 06:30. You must monitor for absence, not just failure.
- Did it succeed? The exit signal - and it should be honest and machine-readable. Distinguish at minimum: all good / some steps failed / configuration is broken. (Tools express this as exit codes; a scheduler can act on them without parsing anything.)
- Is the data fresh? The run succeeding is not the same as the data being current - a run can “succeed” while extracting zero rows against a silently broken source (article 7’s freshness check, viewed from the ops side). Freshness is the metric your stakeholders actually feel.
- Is it drifting? The 40-minute run that now takes 3 hours; row counts quietly doubling. Trends are the early-warning system for next month’s incident.
Alerting: the art of not crying wolf
Section titled “Alerting: the art of not crying wolf”The failure mode of alerting isn’t too few alerts - it’s too many. The team that receives forty emails a night has, functionally, no alerting: the real failure scrolls past with the noise. (article 7’s ignored-red-checks lesson, again, at system scale.)
Principles that survive contact with reality:
- Alert on what someone will act on, at the urgency they’ll act with. Pipeline failed and the dashboard is stale → wake someone (or at least ping the team channel at 06:05). Runtime trending up → a weekly digest. Everything else → a dashboard nobody is forced to look at.
- One incident, one alert. The database being down is one fact, not fourteen node failures’ worth of email. Article 6’s circuit breaker is monitoring’s best friend here.
- Route by audience. Engineers get the stack trace; stakeholders get “data delayed, yesterday’s numbers shown, fix underway” - in the dashboard itself. A visible “data as of” timestamp is the cheapest, highest-value monitoring artifact in this article: it converts silent staleness into honest staleness.
Lineage: the map for the unplanned question
Section titled “Lineage: the map for the unplanned question”Lineage is the record of what feeds what - article 6’s DAG, kept queryable after the run. It’s how the unplanned questions get answered fast:
- Berlin’s missing from Tuesday’s revenue → walk upstream: mart ← enriched ← staging ← extraction… and there it is, the store-API page that timed out.
- We’re changing the CRM’s region field → walk downstream: which tables, checks, and dashboards will feel it? Now the change ships with a list instead of a surprise.
Because the DAG was derived from the code (article 6), lineage is free and always true - one more payoff of that decision.
The 3 a.m. test
Section titled “The 3 a.m. test”Judge an observability setup by replaying one bad night. At Sunrise Bakery: the CRM API starts timing out at 03:12. The pipeline retries with backoff (article 4), fails the CRM extraction, skips its downstream cone, completes everything else (article 6), and exits “some steps failed.” At 06:05, one alert reaches the on-call phone naming the failed node. The dashboard shows yesterday’s data with “as of Sun 06:00.” At 08:30 an engineer reads the run history, sees three timeouts and no data landed, reruns just the missing cone with one resume command, and closes the incident before the 09:00 standup - using the run’s event stream, not archaeology.
Count what had to exist for that story: structured events, run history, honest exit signals, retries, skip-downstream, single-alert routing, a freshness timestamp, resume. Every article of this series so far, visible in one night.
The takeaway
Section titled “The takeaway”- Emit structured events; derive run history, metrics, and alerts from them. Prose logs are for the deep dive, not the detection.
- Monitor the four questions in order: ran at all (absence!), succeeded, fresh, drifting.
- Alerts are for actions; one incident, one alert; tell stakeholders in the dashboard, with a visible “data as of.”
- Lineage - the DAG, kept - is what turns “why is this wrong?” from archaeology into a walk.
Next: 9. Best practices