1. What is a data pipeline?
Monday morning at Sunrise Bakery
Section titled “Monday morning at Sunrise Bakery”Sunrise Bakery is a small chain of bakeries with an online shop. Every Monday morning the owner asks the same question: “How did we do last week?”
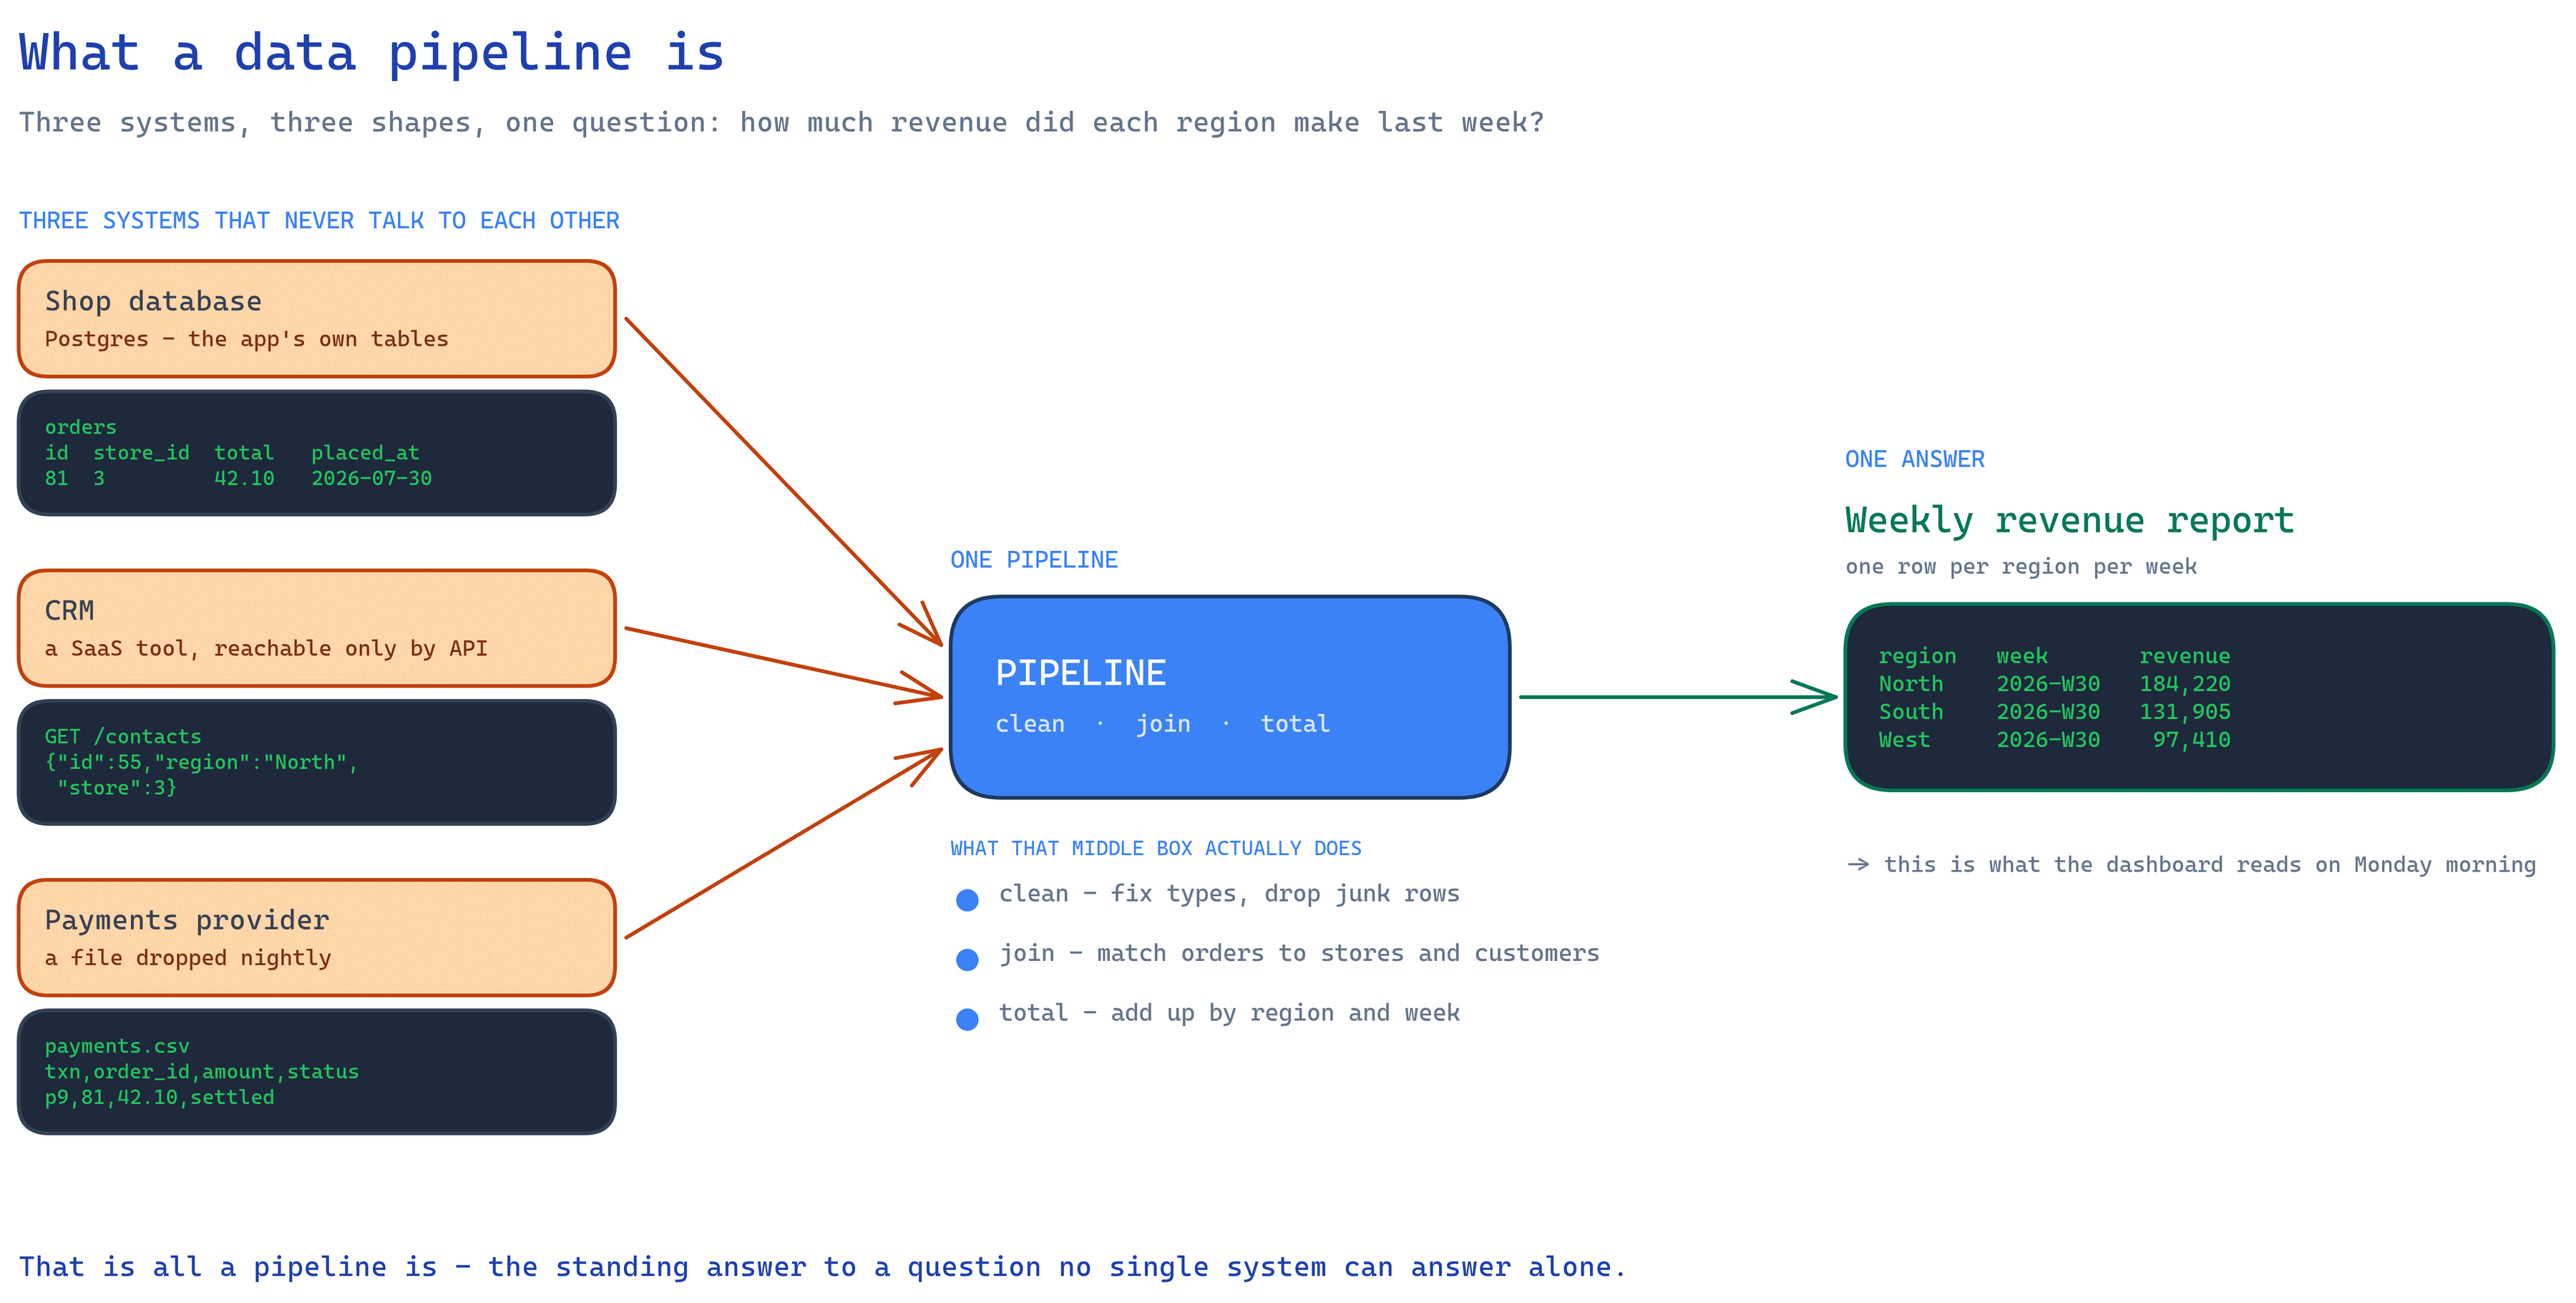
Answering it sounds simple, but the numbers live in three different places:
- Orders are in the online shop’s database.
- Customers are in a CRM (the tool the marketing person uses).
- Payments are in a payment provider, reachable only through its API.
For the first year, an employee named Dana answered the question by hand. Every Monday she
would export orders to a CSV file, download a customer list from the CRM, copy payment totals
from the provider’s dashboard, paste all of it into a spreadsheet, fix the dates (one system
uses 03/02/2026, another uses 2026-02-03), remove the duplicate rows that always appear,
join everything together with VLOOKUPs, and finally produce one number: last week’s revenue,
by store, by product.
It took her two hours. Sometimes she made mistakes. When she went on vacation, nobody knew how to do it. And when the owner asked, “can I see this daily instead of weekly?”, the honest answer was no - nobody has two hours a day for copy-paste.
A data pipeline is Dana’s Monday morning, turned into software.
The definition
Section titled “The definition”A data pipeline is an automated process that moves data from where it is produced to where it is needed, changing it along the way into a shape that’s useful.
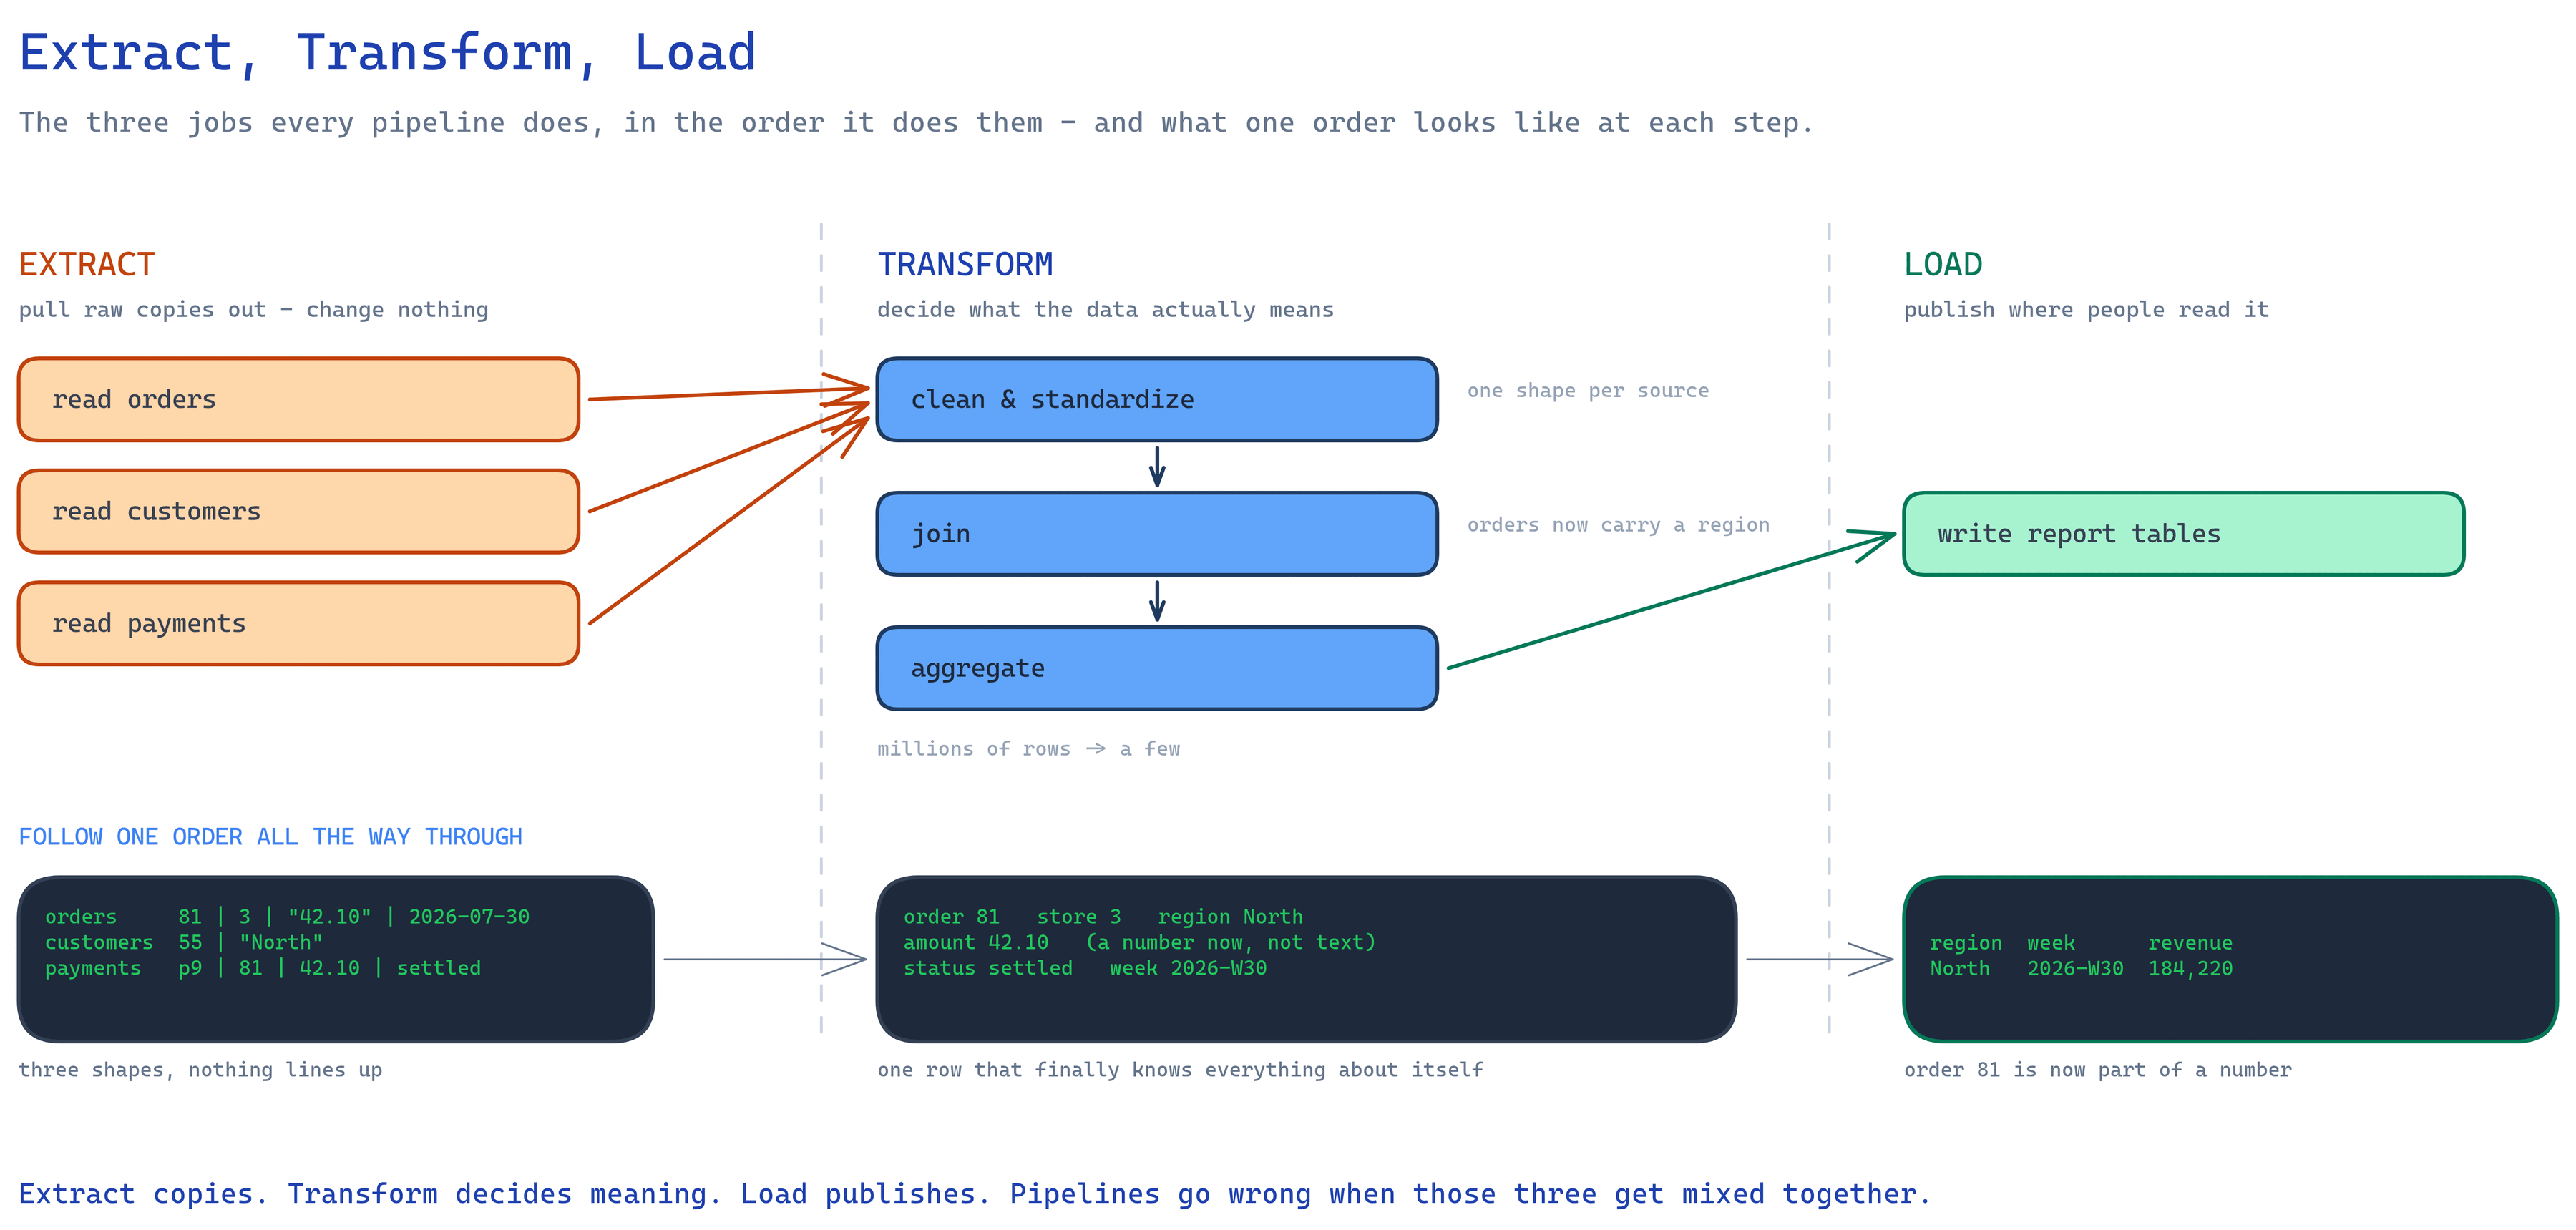
Every pipeline, no matter how fancy, does some combination of three things:
- Extract - get the data out of the systems where it lives (a database, an API, a folder of files).
- Transform - clean it, fix the dates, remove duplicates, join orders to customers, add up totals.
- Load - put the result somewhere people and tools can use it (a report, a dashboard, a database, another file).
The word pipeline is a plumbing metaphor, and it’s a good one: data flows in one direction, through a series of connected stages, and each stage does one job. Like real plumbing, you mostly notice it when it leaks.
Why build one?
Section titled “Why build one?”Dana’s spreadsheet worked. Why replace it? Because each of its weaknesses is exactly what a pipeline fixes:
- It’s manual. A pipeline runs on a schedule without a human. Daily numbers stop being a fantasy; they’re just a configuration change.
- It’s error-prone. Humans mistype, skip steps, and paste into the wrong column. A pipeline does the same steps the same way every time. Consistency is the whole point.
- It’s slow. Two hours of human time becomes two minutes of machine time.
- It’s undocumented. Dana’s process lived in Dana’s head. A pipeline is code: it can be read, reviewed, versioned, and understood by the next person.
- It doesn’t scale. One weekly report is fine by hand. Twelve daily reports across three data sources is not. Pipelines scale by adding steps, not by adding Danas.
- It isn’t trusted. When a number looks wrong, “Dana’s spreadsheet” is hard to audit. A pipeline leaves a trail: what ran, when, on which data, with what result.
That last point is subtle but may be the most important. The real product of a data pipeline isn’t data - it’s trust in data. A dashboard nobody believes is worse than no dashboard.
Who builds data pipelines?
Section titled “Who builds data pipelines?”Job titles vary, but you’ll meet a few recurring characters:
- Data engineers build and operate pipelines as their main job: the plumbing, the infrastructure, the reliability.
- Analytics engineers live between engineering and analysis: they write the transformations (usually SQL) that turn raw data into clean, well-modeled tables.
- Data analysts and scientists are usually the consumers, but often build small pipelines themselves to feed their own analyses.
- Software engineers build pipelines without calling them that - a nightly job that syncs two systems is a pipeline, whatever the ticket said.
At a small company like Sunrise Bakery, one person wears all of these hats. That’s normal, and it’s one reason simple tools matter: the person automating Dana’s spreadsheet is often not a pipeline specialist.
How are pipelines built?
Section titled “How are pipelines built?”At the mechanical level, a pipeline is just a program. The simplest real pipeline in the world is a script and a scheduler:
# crontab: every day at 06:000 6 * * * python export_orders_and_build_report.pyPlenty of businesses run on exactly this, and there’s no shame in it. But as the script grows, the same pains appear in every company, in the same order:
- The script gets a second data source, then a third. Now steps depend on each other - customers must be downloaded before orders can be joined to them. You’ve discovered orchestration (article 6).
- A source starts sending garbage - an order with no ID, a negative price. The report is silently wrong for three weeks. You’ve discovered data validation (article 7).
- The script fails at 6 a.m. and nobody notices until the owner opens an empty dashboard. You’ve discovered monitoring (article 8).
- The orders table grows from thousands of rows to millions, and re-downloading all of it every night stops being reasonable. You’ve discovered incremental loading (articles 3 and 4).
- The script runs twice by accident and every number doubles. You’ve discovered idempotency and delivery guarantees (articles 4 and 9).
Pipeline tools exist because these problems are universal. Whether you use a heavyweight platform or a small CLI tool, you are buying the same things: structure for the steps, a scheduler-friendly way to run them, checks for the data, and a record of what happened.
What a pipeline is not
Section titled “What a pipeline is not”Two boundaries worth drawing early:
- A pipeline is not a database. It moves and reshapes data; the data itself lives in sources and destinations. (Some tools use an internal database as a workbench - we’ll see that in article 10 - but the workbench isn’t the product.)
- A pipeline is not a dashboard. The dashboard is the consumer. The pipeline’s job ends when correct, fresh data is sitting where the dashboard reads it.
Where we’re headed
Section titled “Where we’re headed”Over the next eight articles we’ll rebuild Dana’s Monday morning properly: we’ll see where each system fits in a modern data platform (article 2), pick the right movement pattern (article 3), get the data out and in reliably (article 4), transform it in maintainable layers (article 5), run steps in the right order automatically (article 6), catch bad data before the owner does (article 7), find out about failures before Monday (article 8), and collect the habits that keep all of it trustworthy (article 9).
Then, in Part II, we’ll do all of it for real with a small tool called pz.