2. What modern data infrastructure looks like
Article 1 drew the pipeline as one box between sources and a report. In a real company that box unpacks into a handful of standard pieces. This article is a tour of those pieces - what each one is for, in plain terms - so that when you hear “we load the lake, model in the warehouse, and orchestrate with a scheduler,” you can translate it back to Dana’s spreadsheet.
One reassurance up front: you do not need all of these pieces. Most companies start with three and add the rest only when a specific pain shows up. The map matters more than the shopping list.
The map
Section titled “The map”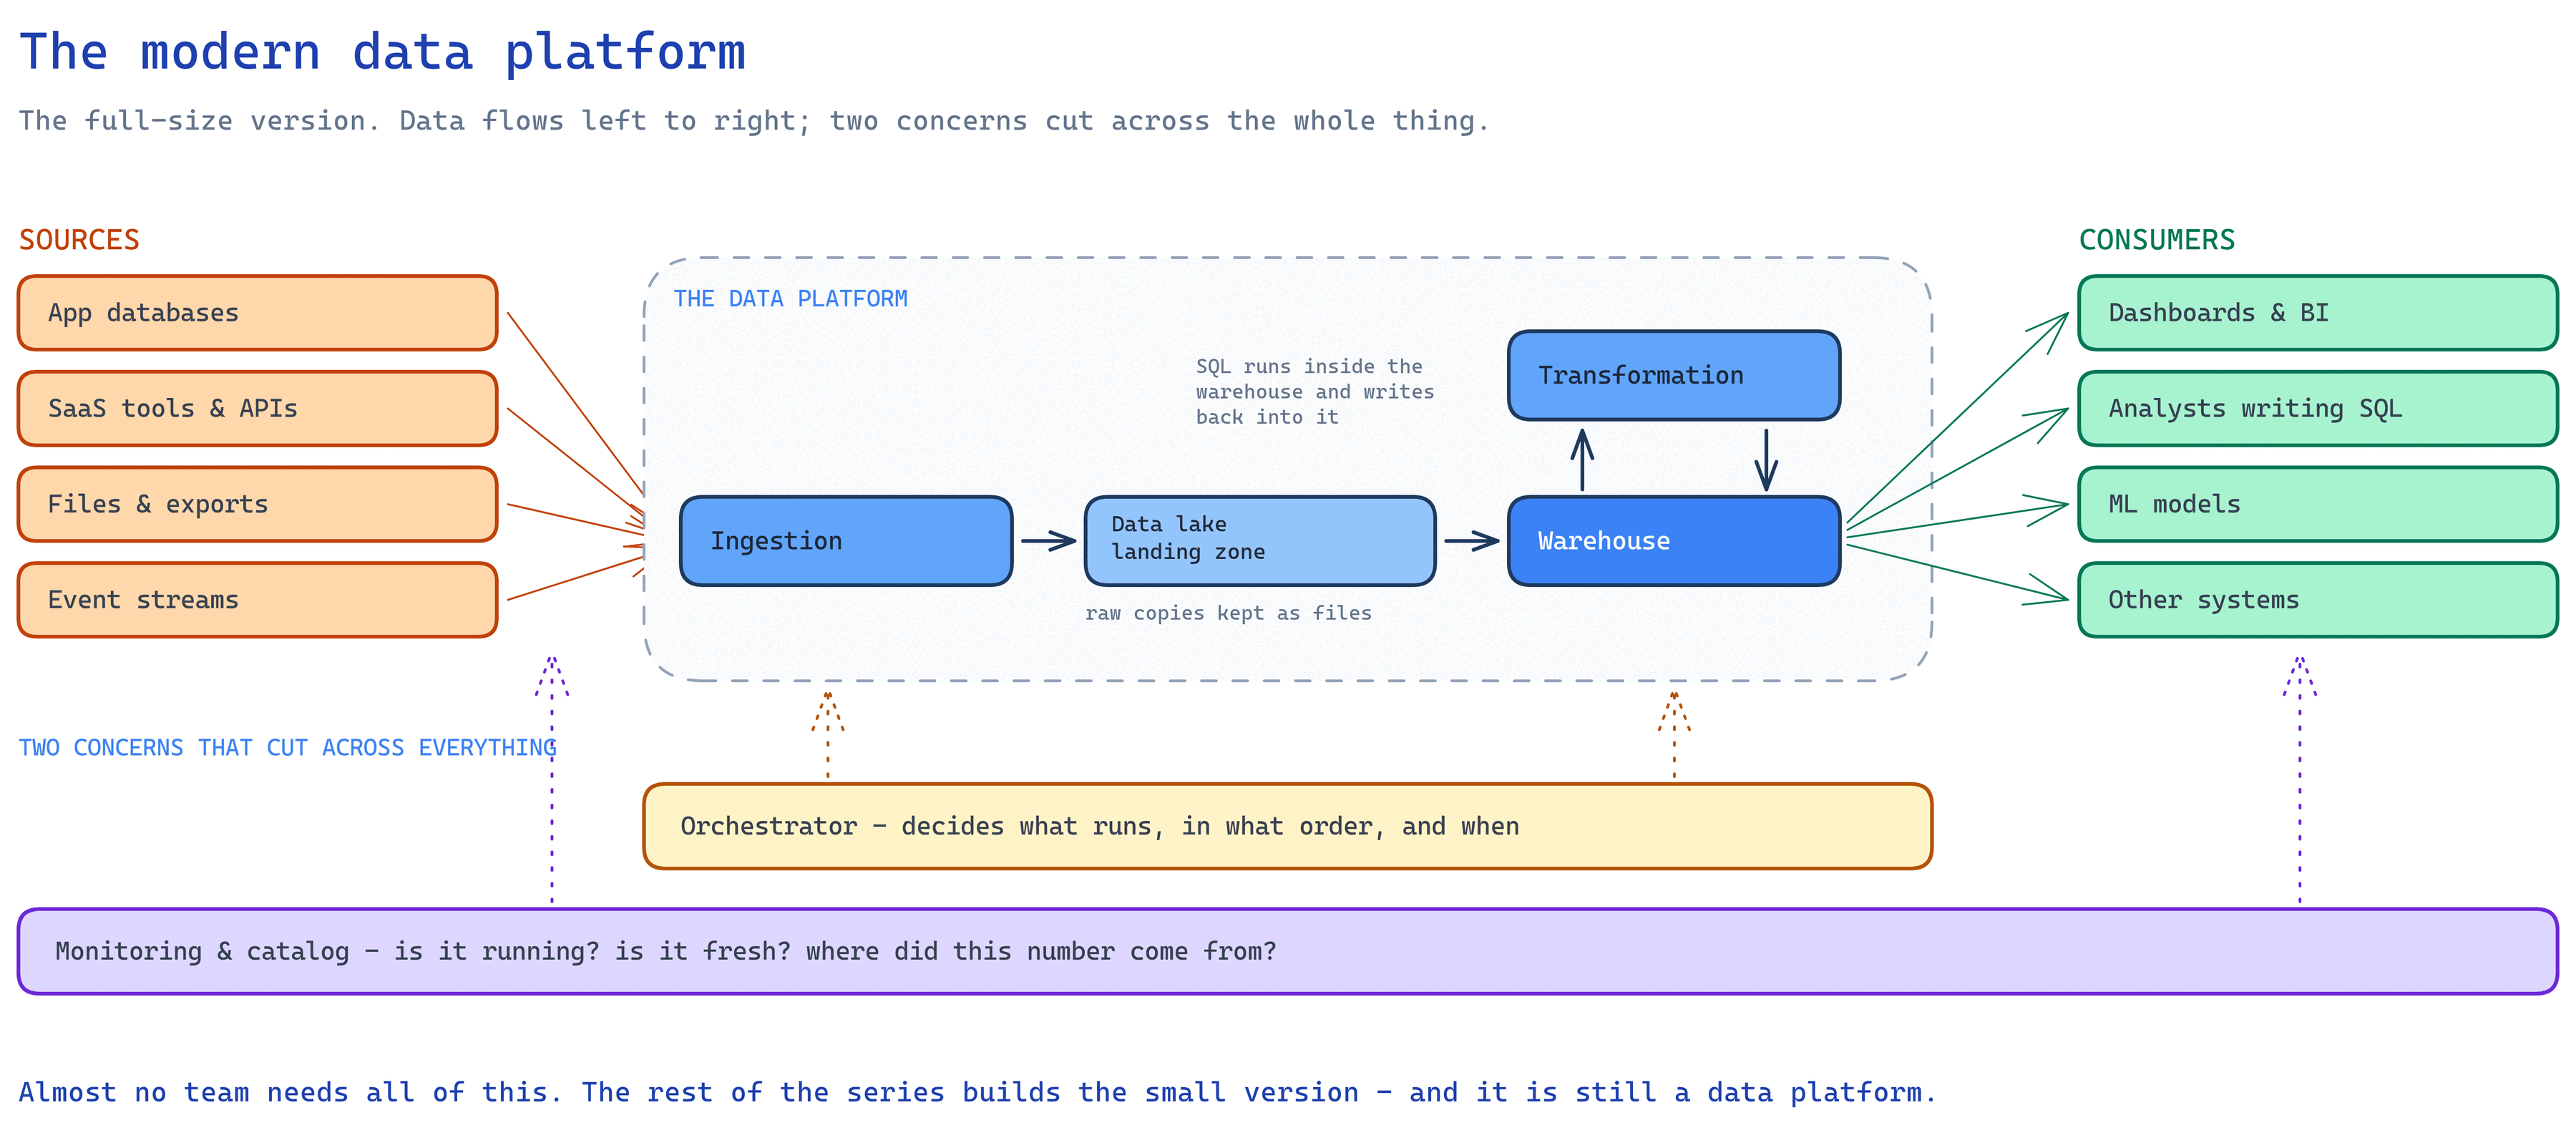
Let’s walk it left to right.
Sources: where data is born
Section titled “Sources: where data is born”Data is a by-product of the business doing its thing. For Sunrise Bakery:
- Application databases. The online shop stores orders in Postgres. These databases are built for running the application - thousands of tiny reads and writes per second, one order at a time. The jargon is OLTP (online transaction processing). Think of a cash register: brilliant at ringing up one sale, terrible at answering “total revenue by product for the last five years” while a queue is forming.
- SaaS tools and APIs. The CRM and the payment provider hold their data behind web APIs. You don’t get a database connection; you get HTTP endpoints that return JSON, usually a page at a time.
- Files. A supplier emails a price list as an Excel file. A legacy till exports a nightly CSV. Files are the cockroaches of data infrastructure - unglamorous and never going away.
- Event streams. Larger systems emit a running commentary of events (“order 1234 placed”, “page viewed”) into systems like Kafka. Sunrise Bakery doesn’t have this yet, and that’s fine.
The key property of sources: they belong to someone else. The shop database exists to run the shop. Running heavy report queries against it can slow real customers’ checkouts - which is the single best argument for copying data out before analyzing it.
The warehouse: where questions get answered
Section titled “The warehouse: where questions get answered”A data warehouse is a database built for the opposite job to OLTP: few users, big questions, whole-table scans. “Total revenue by product by week across three years” - touching millions of rows at once - is exactly what it’s shaped for. The jargon is OLAP (online analytical processing).
The practical differences from an app database:
- It stores data by column rather than by row, so “sum the amount column” reads only the amount column, not every full record.
- It’s where your modeled, cleaned, joined tables live - the tables dashboards read.
- Examples you’ll hear: Snowflake, BigQuery, Redshift, and - at the small end - DuckDB, a warehouse-in-a-file that runs inside a single process. Small does not mean toy: a single machine comfortably handles data volumes that would have needed a cluster fifteen years ago, and most companies’ data is smaller than they think.
For Sunrise Bakery, the “warehouse” can literally be one DuckDB file or a modest Postgres
schema named analytics. The concept - a separate place, shaped for questions, that
pipelines fill - matters more than the brand.
The lake and the landing zone: where raw data rests
Section titled “The lake and the landing zone: where raw data rests”A data lake is much simpler than the name suggests: it’s a big folder of files, usually in cloud object storage (Amazon S3, Azure Blob Storage), usually in an efficient columnar format called Parquet (more on formats in article 4).
Why keep files at all when you have a warehouse? Because raw data is evidence. When a number looks wrong in March, you want the original February extract, untouched, to check against. The common habit is a landing zone: every extraction writes what it pulled, as-is, to dated files before anything transforms it. Storage is cheap; re-extracting data a source no longer has is impossible.
You’ll also hear lakehouse - warehouse-style tables built directly on lake files. File it under “vocabulary,” not “homework”: it’s an optimization big platforms reach for, not a starting point.
Ingestion: the moving trucks
Section titled “Ingestion: the moving trucks”Ingestion (article 4 in depth) is the machinery that copies data from sources into the platform. The unit of reuse here is the connector: a component that knows how to talk to one kind of source - “Postgres connector,” “S3 connector” - so that reading a new source is configuration, not a new program. Good ingestion handles pagination, retries, incremental extraction, and schema changes so each pipeline doesn’t reinvent them.
Transformation: the kitchen
Section titled “Transformation: the kitchen”Raw ingredients in the fridge (the lake / raw tables) become dishes on the menu (clean,
modeled tables) in the transformation layer. In the modern stack this is dominated by
SQL, organized into layers - raw, staging, marts - which is the whole of article 5. Tools
like dbt made this layer famous; pz, the tool in Part II, is of the same family.
The orchestrator: the conductor
Section titled “The orchestrator: the conductor”Someone has to run all of this in the right order at the right time: extract customers before joining orders to them, run the report after both. The orchestrator (article 6) holds the dependency map, the schedule, and the retry logic. It can be as small as cron plus a tool that understands ordering, or as large as a dedicated platform like Airflow.
Monitoring and the catalog: the smoke detectors and the map
Section titled “Monitoring and the catalog: the smoke detectors and the map”Two supporting pieces, both about knowing:
- Monitoring and observability (article 8): did last night’s runs happen, did they succeed, how long did they take, and is the data actually fresh?
- A catalog answers “what does this table mean, where did it come from, who owns it?” At small scale this is honestly a README and good table names; dedicated catalog tools earn their keep when tables number in the hundreds.
Consumers: the reason any of this exists
Section titled “Consumers: the reason any of this exists”Dashboards and BI tools, analysts writing ad-hoc SQL, machine learning models, and - increasingly - other systems: pushing modeled data back into the CRM or the finance tool is called reverse ETL, and it’s just a pipeline pointed in the other direction. The consumer’s needs set the requirements: how fresh, how clean, how fast.
Sunrise Bakery’s actual infrastructure
Section titled “Sunrise Bakery’s actual infrastructure”Here’s the honest version for a three-bakery chain:
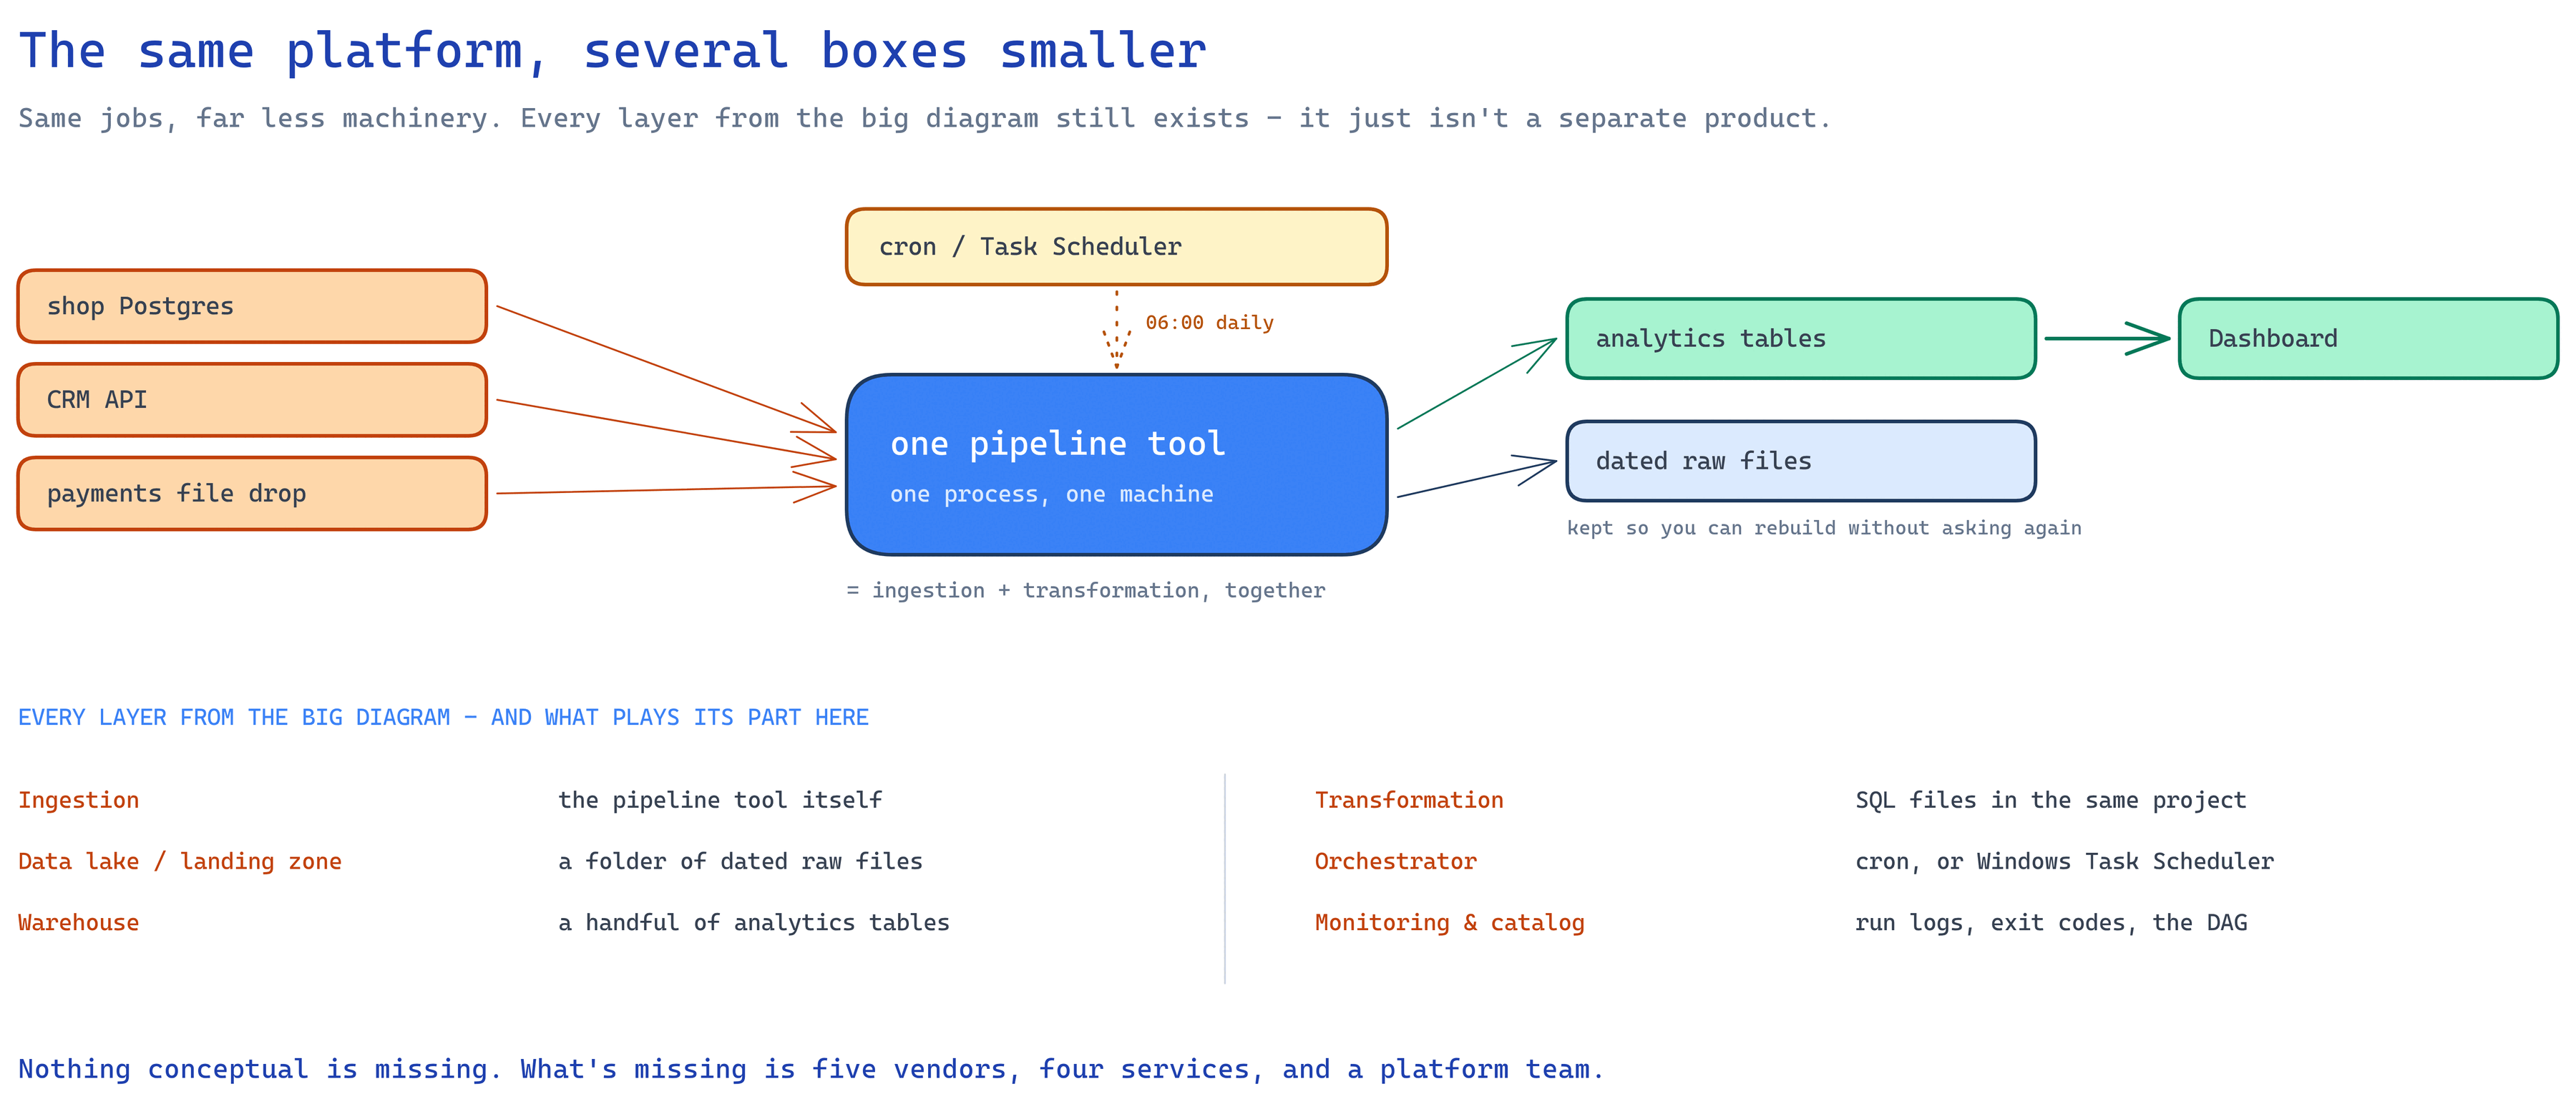
One pipeline tool, one scheduler entry, one set of analytics tables, one folder of raw extracts. Every box from the big diagram is present in miniature - which is exactly the point. Infrastructure should grow from the question “what breaks next?”, not from a vendor’s reference architecture.
The takeaway
Section titled “The takeaway”- Sources are optimized for running the business, not for questions - copy data out.
- The warehouse is the question-answering place; the lake is the cheap, raw archive.
- Ingestion moves data in; transformation reshapes it; orchestration sequences everything; monitoring tells you the truth about it.
- Start small. Every piece should be traceable back to a pain you actually have.