Execution internals
This page is for contributors. It covers the engine half of how a run executes: how DagCompiler
builds a DAG with stable node ids, how the planner and dispatcher move work through it, and what
each phase writes to disk. For the user-facing version, what you see when you run pz run,
see How a run works; this page does not repeat it.
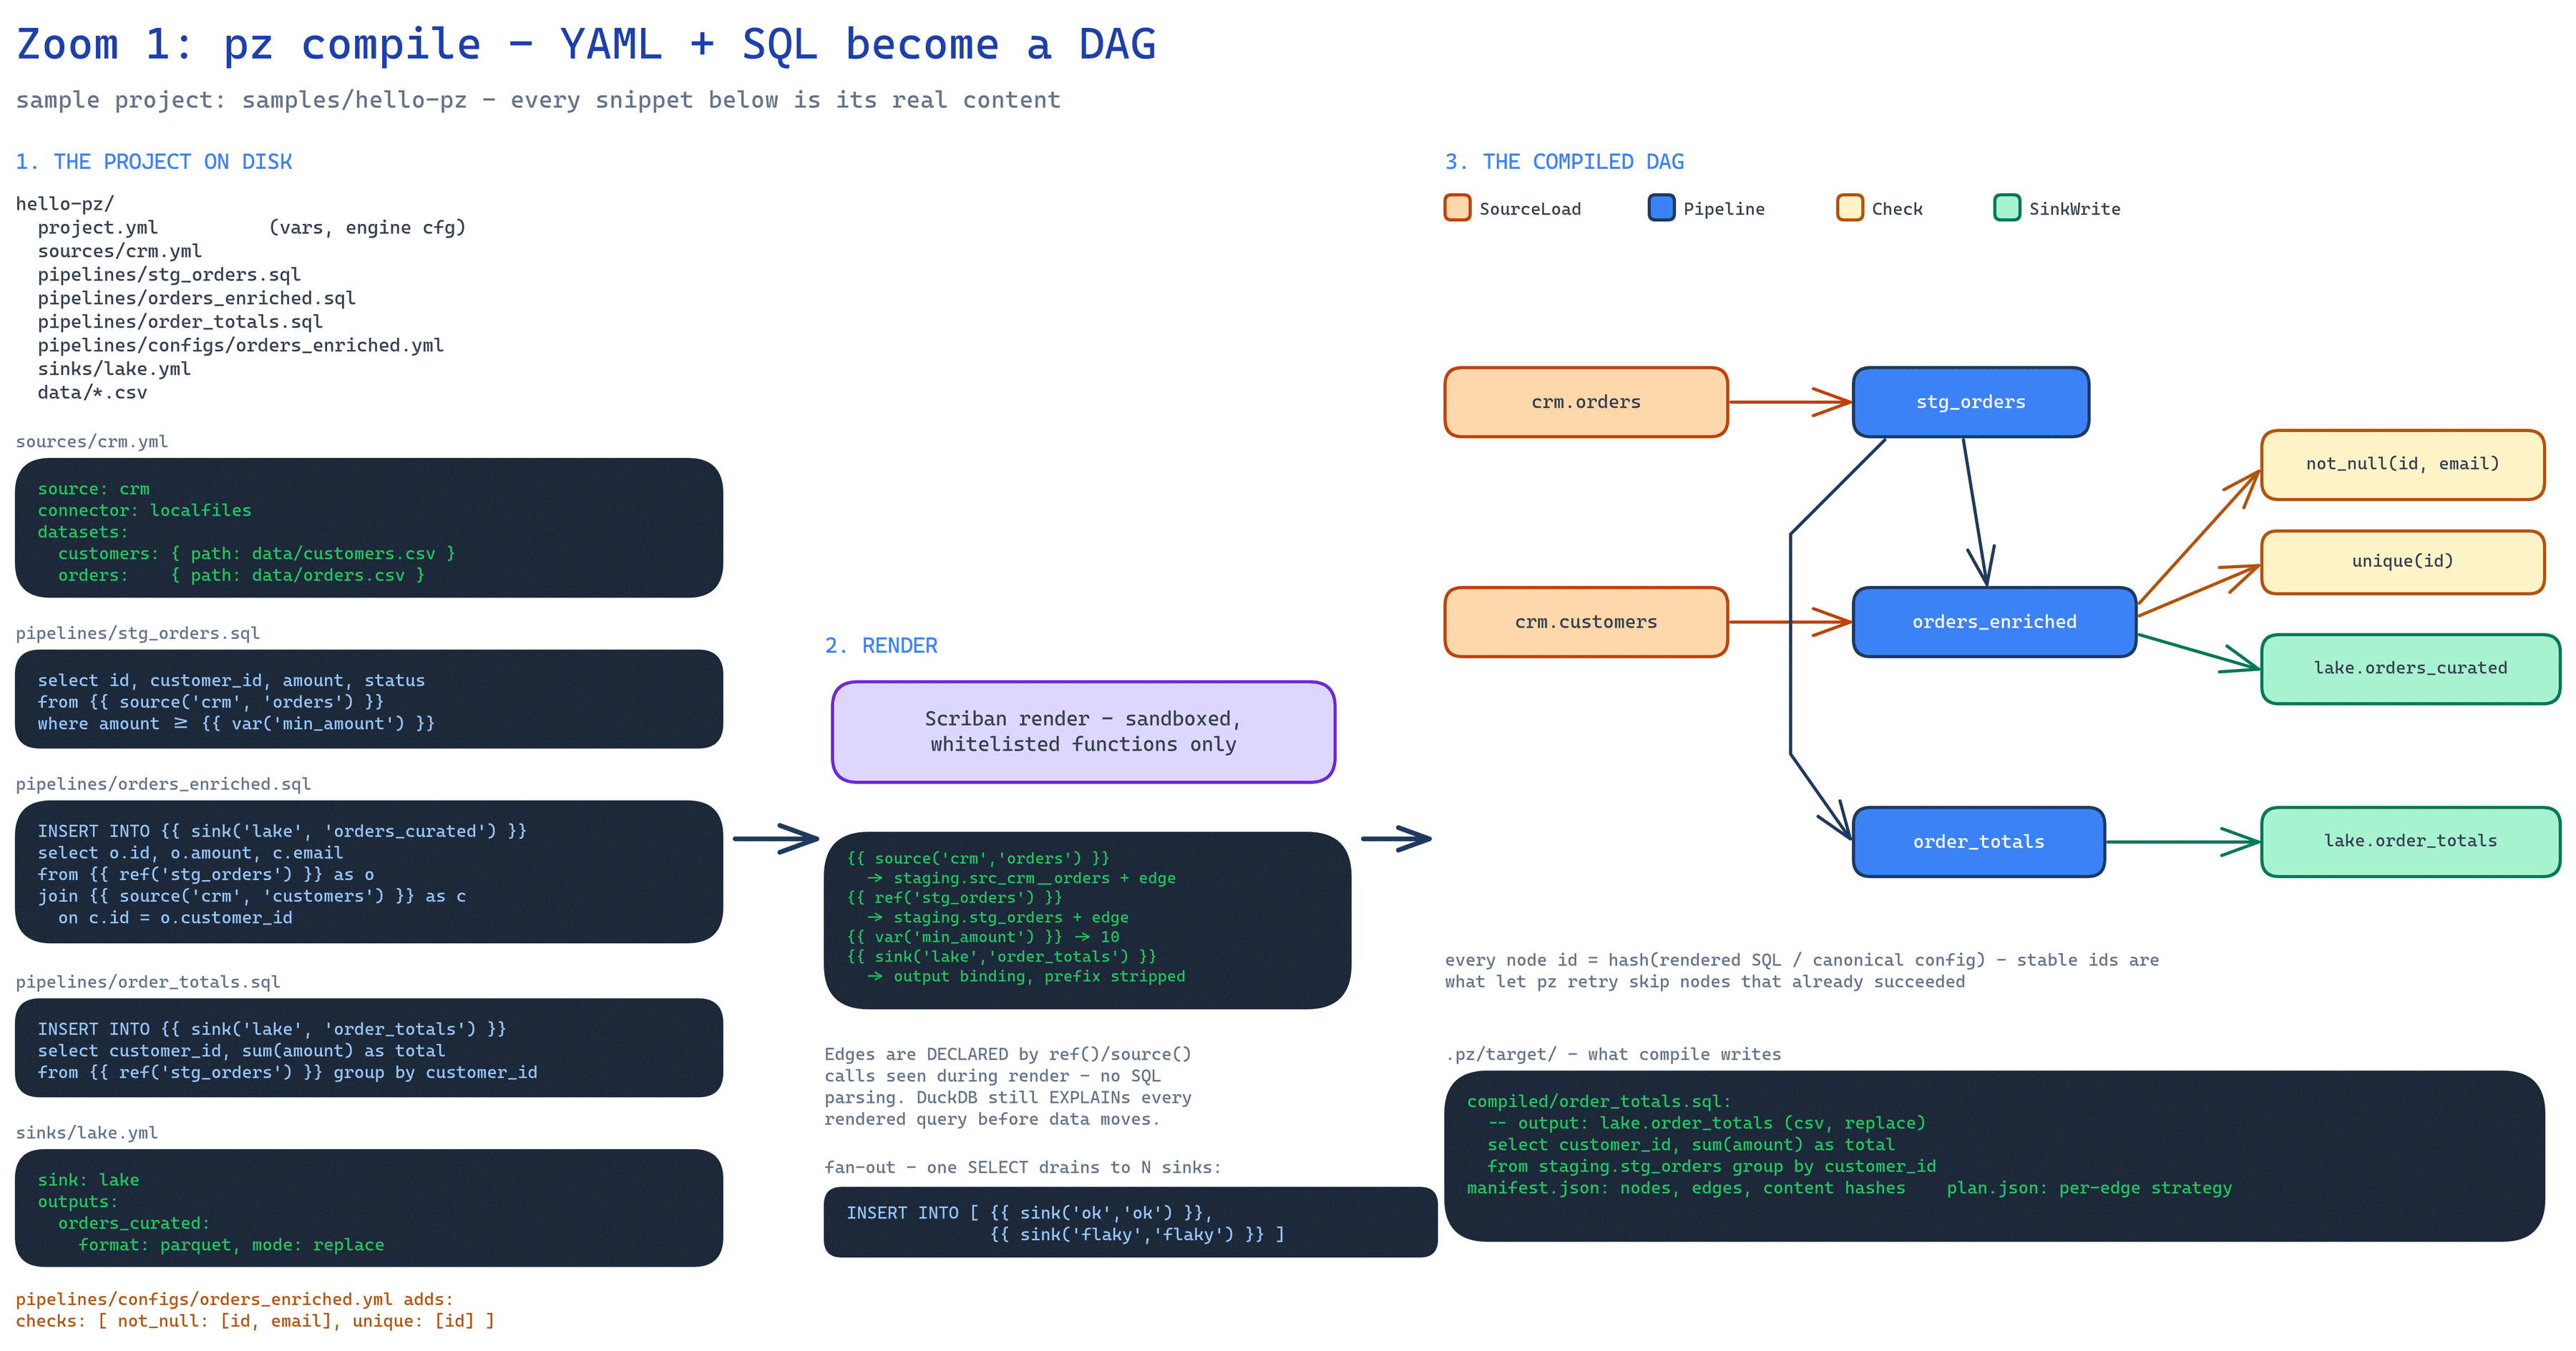
Content-addressed node ids
Section titled “Content-addressed node ids”DagCompiler (Pz.Core/Dag/DagCompiler.cs) renders every pipeline’s SQL through the sandboxed
Scriban template engine, and each source(), ref(), and sink() call observed during
rendering both resolves to a staging table name and records a DAG edge. The compiler never
parses SQL to discover edges; it only watches which template calls fire.
Every node gets a stable, content-addressed id: a hash of its rendered SQL or canonical
config, not of when it was compiled. Same inputs, same id, every run. That single property is
what lets pz retry and incremental watermarks recognize “the same node” across runs without
any separate identity scheme. ReadHints, the column and predicate pushdown extracted from
pipeline SQL (see Connector architecture: ReadHints extraction and
joins for the join-aware
rules), feed into a SourceLoad’s content hash too, so a pipeline edit that changes what gets
pushed down changes the node’s identity.
Nodes are topologically sorted with Kahn’s algorithm (TopologicalSortOrThrow) and
deterministic tie-breaking, so a ref() cycle fails with a named dependency cycle: a -> b -> a
error instead of hanging.
The planner
Section titled “The planner”ExecutionPlanner (Pz.Engine/Planning/) runs after validation and decides, per edge,
how data will physically move: native scan/copy or the universal Arrow stream, partition counts,
batch sizes, and node order. It writes plan.json, which pz plan pretty-prints, including the
reason a fast path was or wasn’t chosen. See The data plane for the
tier-selection rules the planner applies.
Dispatch and channels
Section titled “Dispatch and channels”RunOrchestrator (Pz.Engine/Dispatch/RunOrchestrator.cs) is an event-driven dispatcher, not a
loop:
- Every node tracks how many dependencies it’s still waiting on.
- A node with zero outstanding dependencies is dispatched immediately, up to
engine.threadsconcurrent nodes at once, gated by aSemaphoreSlim. - When a node succeeds, it decrements each child’s counter; a child that hits zero is dispatched right then.
- When a node fails, every descendant is marked
Skipped(CascadeSkip). Siblings elsewhere in the graph keep running unless--fail-fast. - The run ends when the outstanding-work counter drains to zero. Every node ends with exactly
one result:
Success,Failed, orSkipped.
Each dispatched node goes to KindDispatchingExecutor, a switch on node kind that routes to the
right executor and wraps every node with the shared machinery: engine-level retries for
transient connector errors, and error wrapping so an executor exception becomes a Failed
result instead of killing the run.
Within a SourceLoad on the universal path, extraction and ingest run as two overlapped stages
connected by a bounded channel:
[connector reader(s)] ──▶ BoundedChannel<RecordBatch> ──▶ [DuckDB arrow_scan ingest] (async I/O, possibly capacity: 4 (native threads) N parallel partitions)A slow ingest suspends readers; a slow source leaves DuckDB idle to serve other nodes. The
engine measures wait time on both sides of every channel, which is what lets it name a
bottleneck instead of making an operator infer one. SinkWrite mirrors this: a DuckDB result
stream feeds a channel that one or more writer sessions drain.
Node executors
Section titled “Node executors”KindDispatchingExecutor routes each of the four node kinds to its own executor:
| Node kind | Executor | Does |
|---|---|---|
SourceLoad |
SourceLoadExecutor |
Lands a dataset into its staging table, native scan or overlapped extract/ingest. |
Pipeline |
PipelineExecutor |
Runs the rendered SQL as CREATE TABLE staging.<name> AS <select> (or a view). |
Check |
CheckExecutor |
Runs a data-quality assertion query against a pipeline’s staging table. |
SinkWrite |
SinkWriteExecutor |
Drains a staging relation through the sink connector; native COPY or a write session. |
The whole run shares one serialized DuckDB connection, gated by a SemaphoreSlim.
Concurrency comes from the dispatcher overlapping different kinds of work, not from parallel
DuckDB connections. A single DuckDBConnection is not safe for concurrent statement execution,
and unguarded dispatch used to race on DuckDB’s native pending-query state; the gate is a
correctness fix, measured close to free (concurrent/sequential ratio 0.94 to 1.04).
The eight phases, in order
Section titled “The eight phases, in order”Every verb runs the same rails and stops at a different station. RunCommand.Execute/
ExecuteRun in Pz.Cli/Commands/RunCommand.cs is the actual order the code runs in:
load ▶ compile ▶ validate ▶ restore-check ▶ plan ▶ dispatch ▶ finalize ▶ report- Load:
ProjectLoader.Loadparsesproject.yml,connections.yml, and every file underpipelines/into one immutablePzProject. Env vars are interpolated,--varsoverrides applied. - Compile:
DagCompiler.Compilerenders templates, extracts DAG edges, and produces theCompiledDagin memory.pz compilewrites it to.pz/target/manifest.json. - Validate: the SQL dry-compile (
SqlDryCompiler) runs every rendered pipeline through DuckDB’sEXPLAINagainst empty contract-derived tables, before the real staging session ever opens. A rejection here creates no.pz/runs/directory. - Restore-check:
ConnectorRegistryFactory.CreateAsyncbuilds theConnectorRegistry. Builtins resolve straight to the in-process instance, and every other declared connector must be aruntime: "process"package, wired to a spawnableProcessConnectorHostentry driven over PCP. - Plan:
ExecutionPlanner.PlanAsyncwrites.pz/target/plan.json. - Dispatch:
RunOrchestrator.ExecuteAsyncruns the DAG, checkpointing every node completion into.pz/runs/<id>/run_results.jsonincrementally, which is crash-safe. - Finalize: sinks committed or aborted. The watermark and sync-state stores advance last, only after every downstream sink for a dataset has committed.
- Report: a human summary plus the machine artifacts, and an exit code: 0 ok, 1 completed with node failures, 2 config or validation error, 3 fatal.
pz compile and pz plan stop early, after their own phase.
Artifacts
Section titled “Artifacts”| Artifact | Written by | Contains |
|---|---|---|
.pz/target/manifest.json |
compile | The full node-and-edge graph: nodes, edges, content hashes, configs. |
.pz/target/plan.json |
plan | Per-edge tier decisions and reasons, partition counts, batch sizes, a computed memory budget. |
.pz/runs/<id>/staging.duckdb |
dispatch | The run’s disk-backed DuckDB staging database. Retained after every run, success or failure. |
.pz/runs/<id>/run_results.json |
dispatch, finalize | Run-level runId, status, startedAt, and finishedAt (the last written only once the run reaches a terminal status, so its absence distinguishes “still running” from a crashed run’s last snapshot), plus one entry per node: status, rows moved, duration, error, and optional provenance/watermark fields and, since 0.10.0, the node facts (connector, connection, strategy, stages, attempts). The terminal write adds phases, the milliseconds per run phase including finalizeMs. Rewritten after every node completes, not once at the end. |
Observability
Section titled “Observability”All spans are ActivitySource("Pz.Engine") activities (run, node, stage); all counters are
System.Diagnostics.Metrics meters (pz.rows_moved, pz.bytes_moved, pz.batches,
pz.node.duration). pz.run.completed increments once per run at completion, tagged
pz.run.status. --otel-endpoint (or the matching environment variable) wires the OTLP
exporter; the cost is zero when it’s off.
Since 0.10.0 the spans carry the run’s facts. The run span is back-dated to the run’s first phase,
has a phase.<name> child per phase, and carries pz.run.status, pz.run.node_count and
pz.run.nodes.succeeded/failed/skipped. It ends in error when the run fails or stops early, naming
the phase, and records a breaker.state_changed event for each circuit-breaker transition. A node span
carries pz.node.kind, pz.node.rows, pz.connector, pz.connection, pz.node.strategy,
pz.node.attempts, pz.stage.{extract,ingest,egress,write}_ms, pz.ops.*, the producer and consumer
stall (pz.node.producer_stall_ms, pz.node.consumer_stall_ms), pz.node.provenance,
pz.node.caught_up, and the pz.partitions.*, pz.delivery.* and pz.cdc.* counts, each only when it
applies. A failed node gets an error status whose description is the error code, error.type set to
that code, and an exception event with only exception.type and pz.error.code; each retry is a
retry_scheduled span event with attempt, max_attempts, delay_ms, exception.type and
pz.error.code. Messages never go on a span; they stay in run_results.json, the NDJSON events and the
console. SQL text,
connection config, watermark values, sync tokens and CDC positions never go on a span. Executors never call Console.WriteLine directly.
They report through one typed event stream (IRunEvents/RunEventBus), and the console tree,
the NDJSON renderer, and OTel are all views over the same events. The run_results.json writer
is registered directly on the event fan-out, not through renderer machinery, so a hung or broken
renderer can never corrupt the run record.
Related
Section titled “Related”- How a run works: the user-facing phases, dispatch, and exit codes.
- The data plane: the tiers
ExecutionPlannerchooses between. - Resume internals: what
pz retryreuses from these artifacts. - Architecture: where
Pz.CoreandPz.Enginesit in the layering.