How a run works
This page explains the path a project takes from pz run to a finished result: what gets built,
in what order, and what lands on disk. Read it once you understand
key concepts and want to know what actually happens during a run.
What it is
Section titled “What it is”A run is one execution of the compiled dependency graph. Every command
that touches a project, from pz ls to pz run, starts the same way: load the project, then
build the graph. Where each command stops differs. pz run, pz test, and pz retry go all
the way through, dispatching nodes and writing results; pz compile and pz ls stop right after
the graph is built; pz plan goes one step further, resolving connectors, to show the strategy
each node would use.
Why it matters
Section titled “Why it matters”Knowing the shape of a run tells you where to look when something goes wrong. A rejected project
never gets a run directory. A node that fails partway still leaves a readable result for
pz retry. The console output and the exit code both describe the same underlying phases, so
once you know the phases, both make sense at a glance.
How it works
Section titled “How it works”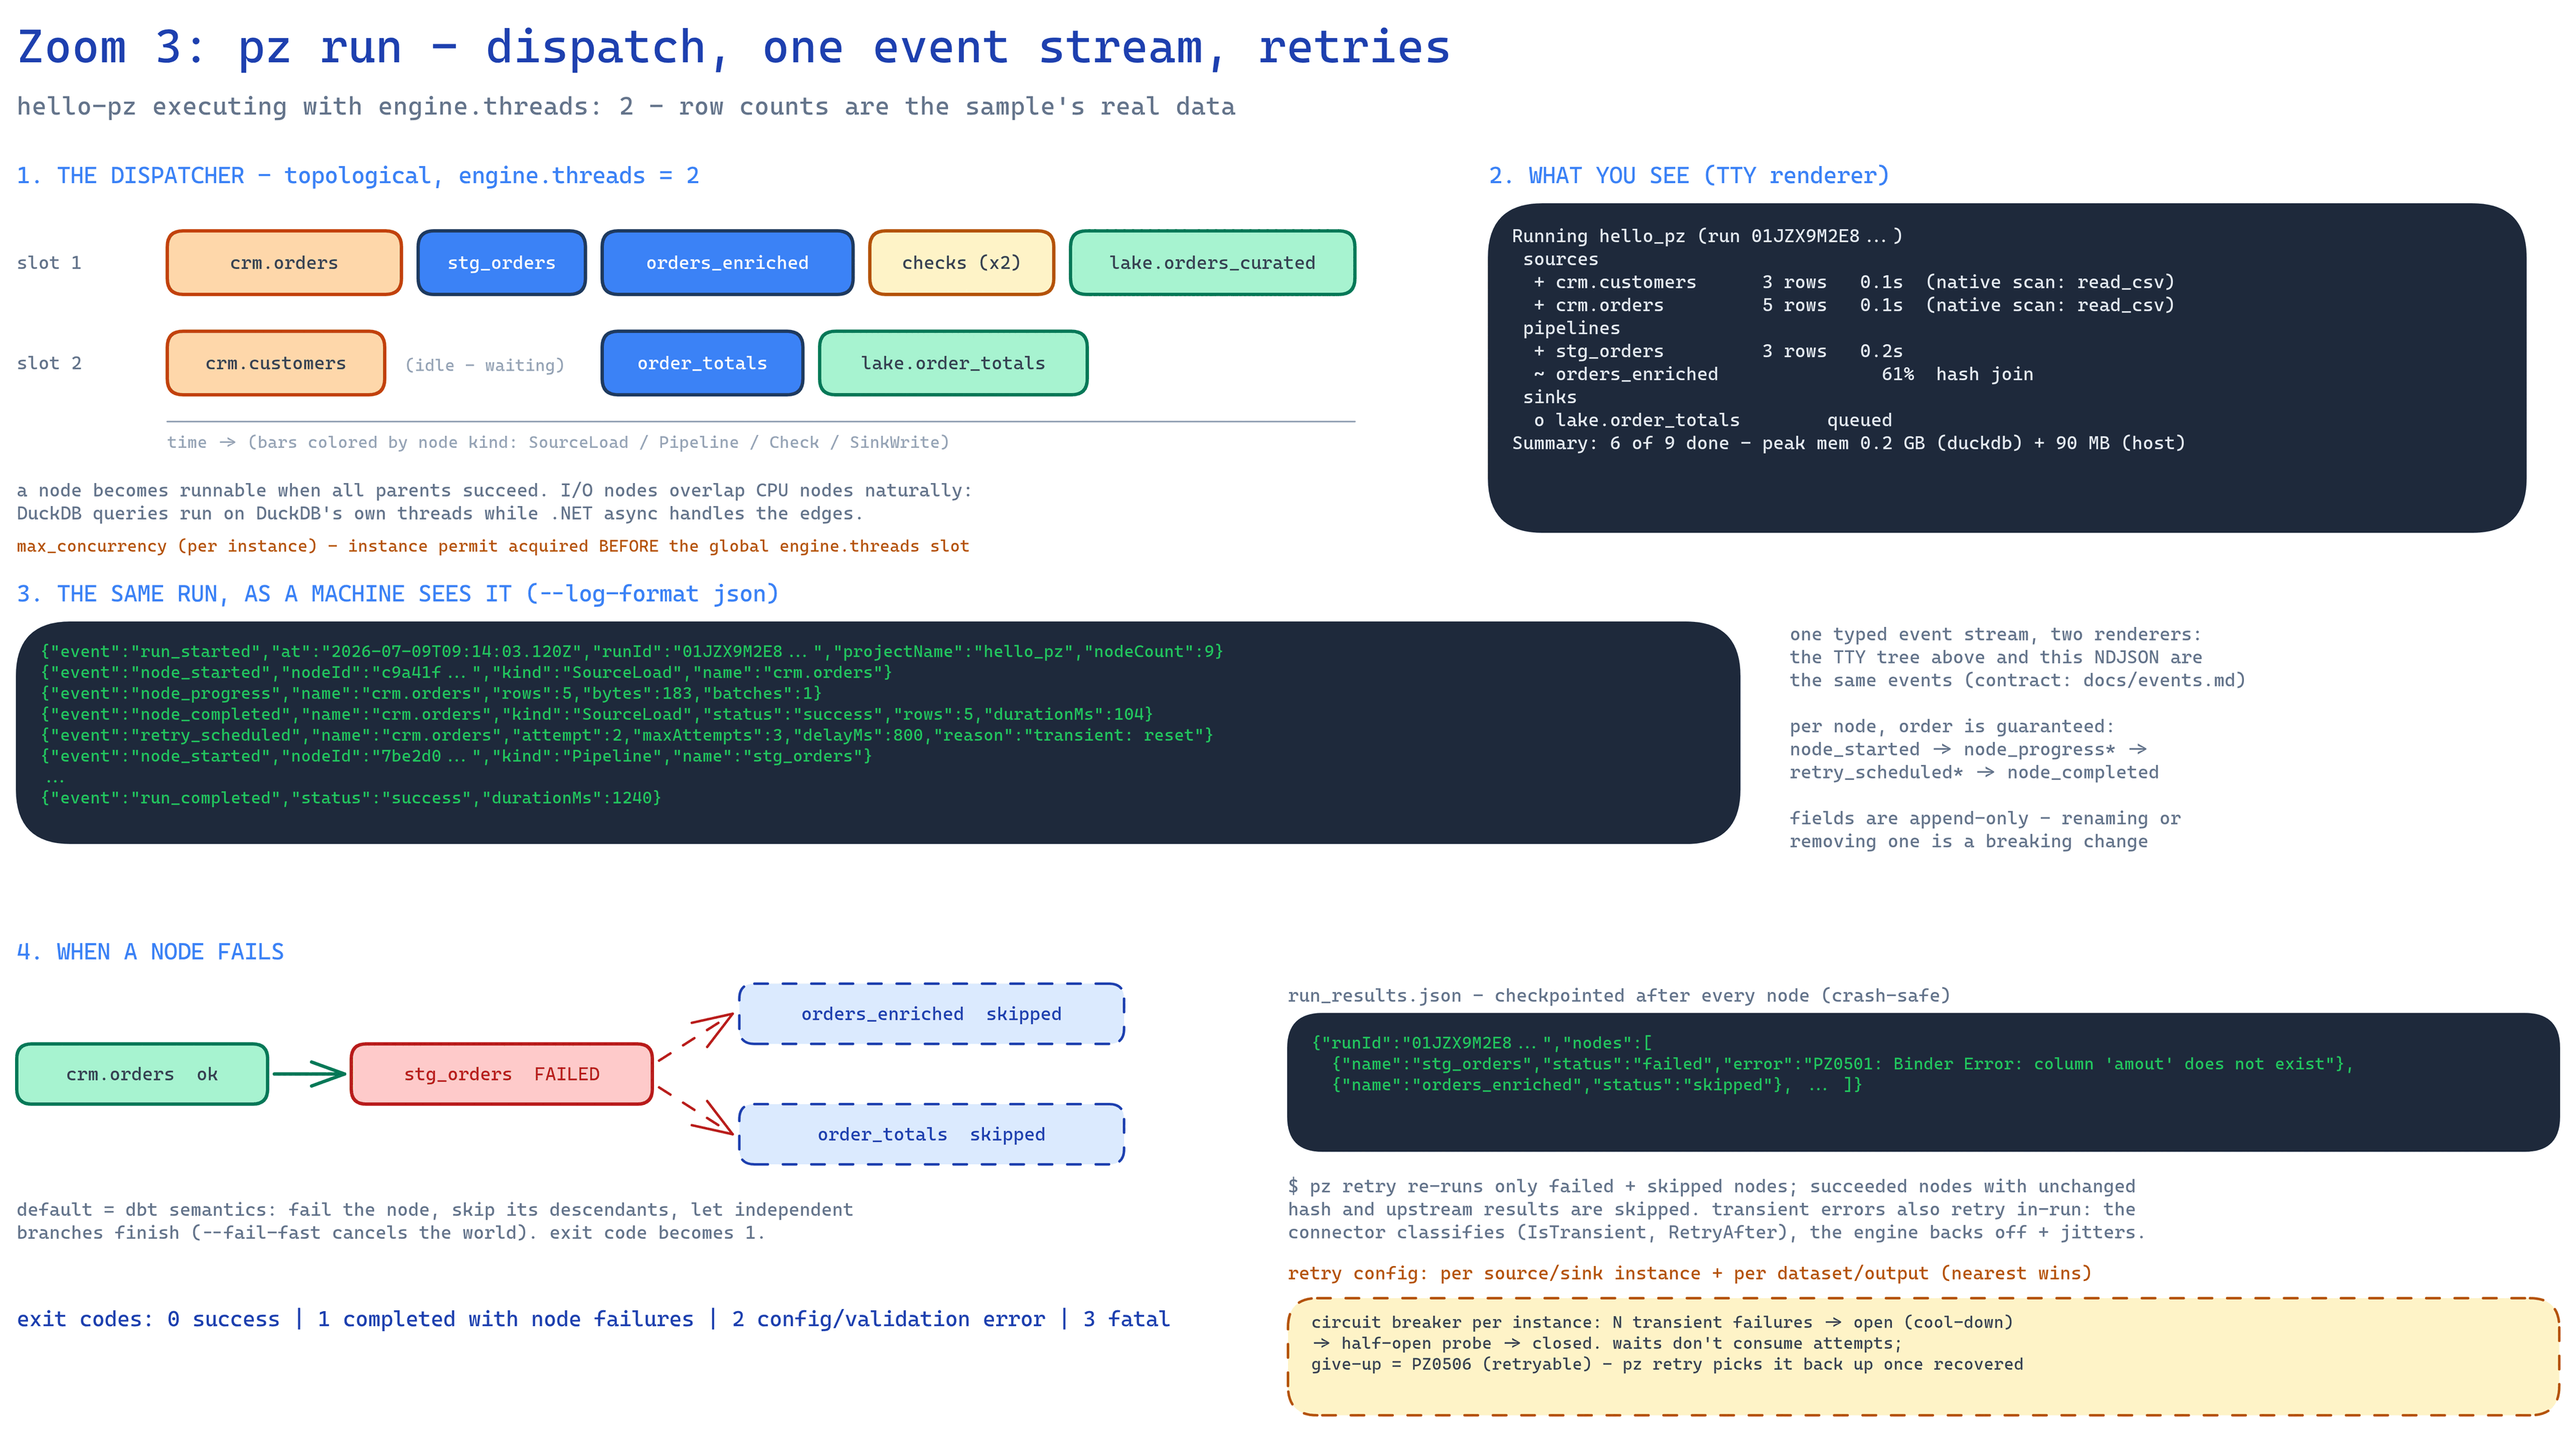
pz parses project.yml and connections.yml, interpolates environment variables, and applies
any --vars overrides. A malformed file stops here with a PZ01xx error and no run directory is
created.
Compile
Section titled “Compile”Every .sql file under pipelines/ renders as a template. Rendering is how pz discovers the
dependency graph: each source(), ref(), and sink() call declares one edge as it fires, and
pz never parses SQL to guess at edges it wasn’t told about. The result is a graph of exactly
four node kinds:
- SourceLoad loads one entity from a connection into the staging database.
- Pipeline runs one pipeline’s
SELECTagainst the staging database. - Check runs one data-quality assertion against a pipeline’s result.
- SinkWrite writes one entity out to its destination.
pz compile and pz ls stop here. pz compile writes the rendered SQL and a machine-readable
manifest.json to .pz/target/; pz ls just prints the graph, one row per node.
Validate
Section titled “Validate”Before pz run, pz test, or pz retry opens a real staging database, they dry-compile every
pipeline’s SQL against empty tables shaped by its known columns. This catches a broken query
before any node executes, rather than as a node failure partway through a run. See
Validation and errors for the full set of validation tiers, including
the ones pz validate runs explicitly.
Restore-check
Section titled “Restore-check”pz verifies pz.lock.json still matches the connectors project.yml declares, unless
--no-lock-check was passed, then starts each connector: builtin connectors run in-process,
restored ones as their own process. This is also where a selection (a flow name, --select, or
--all) is resolved into the exact set of nodes to run. See
Selecting nodes.
For every edge, pz decides how the data actually moves: a native path when the connector can
hand DuckDB the work directly (native_scan for a read, native_copy for a write), or the
universal batch path (duck_sql) otherwise. pz plan prints this table without running
anything; pz run computes the same plan and writes it to .pz/target/plan.json.
Dispatch
Section titled “Dispatch”Nodes run as soon as every parent has succeeded, up to engine.threads at once. This is a
topological dispatcher with one global concurrency limit, not a fixed stage-by-stage schedule, so
independent branches of the graph run in parallel automatically.
Finalize
Section titled “Finalize”Sinks commit or the node is marked failed. The staging database is kept regardless of outcome, so
a later pz retry can reuse what already landed. Automatic retention then reclaims disk from
older runs, governed by retention: in project.yml. See State for what
retention deletes and what it always keeps.
Report
Section titled “Report”pz prints one line per node as it finishes, a summary line, and exits with a code describing
the outcome.
Console output
Section titled “Console output”Each node prints as it completes:
ok stg_orders 5 rows 12msok orders_enriched 5 rows 8msok check_orders_enriched_not_null_id_email 5 rows 3msFAIL lake.order_totals 0 rows 4msThe marker is ok, FAIL, or skip. The run ends with a summary line naming the run ID and
where its results landed:
run 20260902T101533221Z-4c1a: 6 succeeded, 1 failed, 0 skipped (.pz/runs/20260902T101533221Z-4c1a/run_results.json)Exit codes
Section titled “Exit codes”| Code | Meaning |
|---|---|
0 |
Every node succeeded. |
1 |
The run finished, but at least one node failed. |
2 |
A configuration or validation error stopped the run before it started. |
3 |
An unexpected, fatal error. |
Artifacts
Section titled “Artifacts”Each run gets its own directory, .pz/runs/<run-id>/, holding:
staging.duckdb: the embedded staging database every read, pipeline, and write for that run went through.run_results.json: per-node status, timings, and row counts, written incrementally as nodes finish so a crash mid-run still leaves a readable file. Since 0.10.0 it also records how long each phase took and, per node, the connector, connection, data-plane tier, and stage times (fields).pz retryreads this to know what to redo.
Two more files live one level up, in the project-wide .pz/target/ directory, and get
overwritten on the next pz compile or pz run: manifest.json (the compiled graph) and
plan.json (the per-node execution strategy). See State for the rest of
.pz/’s layout, including where watermarks live.
Related
Section titled “Related”- Key concepts: node, flow, and staging database defined.
- Selecting nodes: narrowing a run to part of the graph.
- Validation and errors: every tier a project passes through before it runs.
- State: the full
.pz/layout and what survives between runs. - Execution internals: channels, batching, and how nodes actually move data, for contributors.